Is There a Spectrophotometer in Your Future? (MYIRO-1 or i1Pro3)
The Latest and Greatest For Making Your Own Profiles
Or maybe you have one already but may want to renew or upgrade it? I start by mentioning that this article is intended for an audience that may have widely varying knowledge of what these color management tools do, or even about what color management is. So, if you read words here that waste your time, it’s great that you’re more advanced, but please remember I’m writing for a broad audience. My focus is on RGB Inkjet printers and papers.
Up to this year, X-Rite has been pretty much the dominant provider of mid-priced professional-grade, hand-held instruments, and software for profiling monitors and printers. The choices for such profiling systems expanded this year with Konica-Minolta’s (KM) introduction of the new MYIRO-1 spectrophotometer and its associated software MYIROtools.
I’ll start with some brief comments about why you may want to be interested in any of this, and then drill down into the options for doing it.
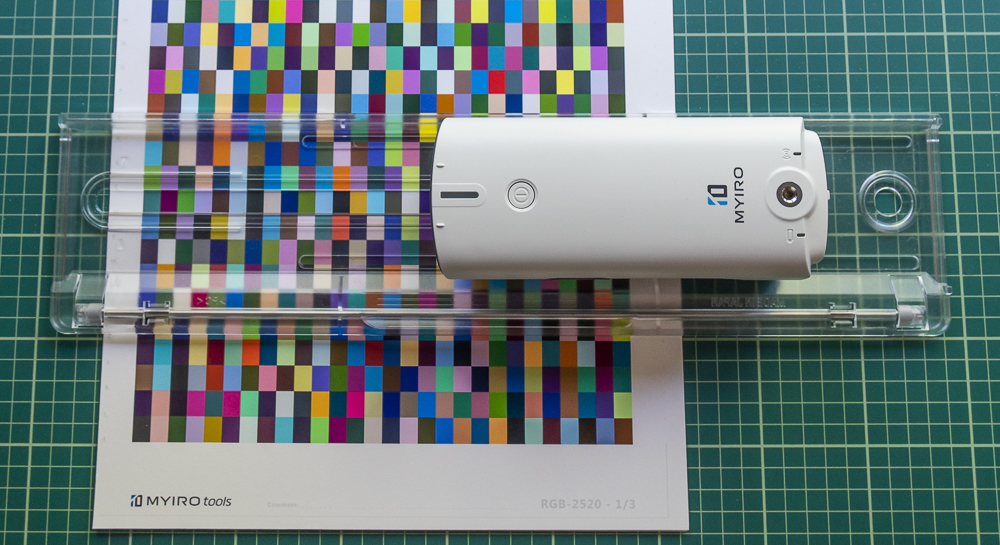
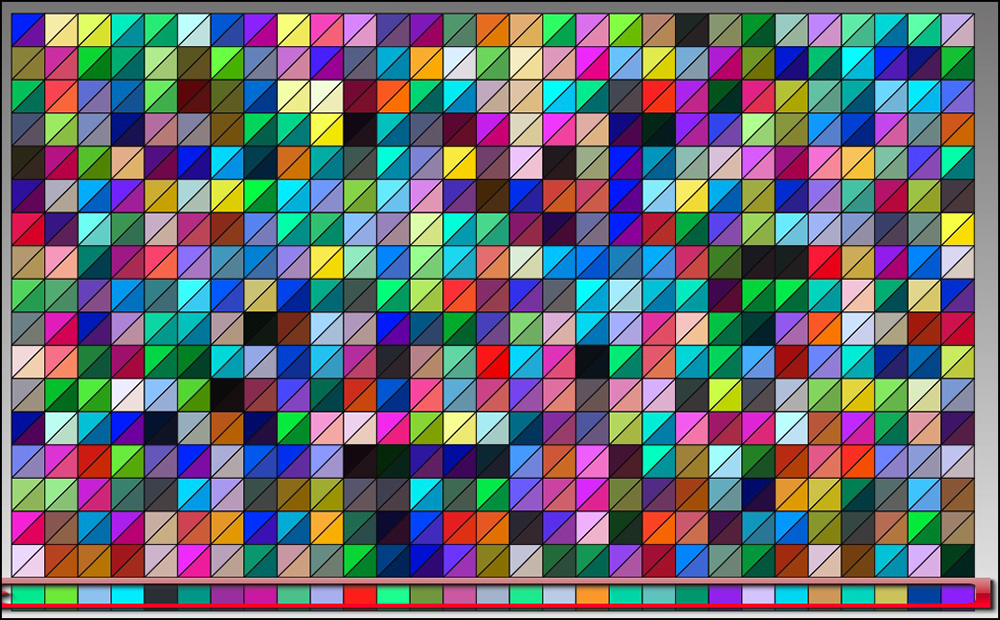
Profiling systems help us to achieve good color management of our digital image production. Different devices “see” colors differently. Profiling characterizes how the monitor and printer reproduce colors. The role of the spectrophotometer is to measure and transmit to storage the necessary color information about how these devices render colors by reading color patches in profiling targets (Please see our “cover” photo).
For those of us interested in no surprises between what we see on our monitors and what we get from our printers, custom profiling of both the monitor and the printer/paper combination is useful. We can obtain usable results using manufacturer-supplied generic profiles for both monitor and printer/paper, but the most accurate results will come from custom profiling our own monitors and printers/papers. Bespoke profiles are recommended for each different printing condition (paper, ink, resolution, printing speed), because different papers absorb and reflect ink differently. The color management modules of our computer operating systems use profile data to translate colors between devices such that, if done and used properly, what comes out of our printers will look pretty much look like what we see on our monitors – provided we have also properly calibrated and profiled our monitors.
Profiling a monitor does not require the devices I’ll be reviewing here. There are less expensive colorimeters and software on the market to serve that purpose very well. (I reviewed in May 2020 basICColor Display 6 paired with an X-Rite i1Display Pro colorimeter .) However, for profiling printer/paper combinations one uses a spectrophotometer, and the same device may also be used for profiling monitors.
In this review, I shall be focusing on printer/paper profiling. In the Annex to this review, Christopher Campbell, who also tested the MYIRO system, provides his experience using it for display profiling in conjunction with basICColor Display 6.
For the benefit of those not familiar with the processes in which spectros are used, the bare-bones “menu” for profiling a printer/paper combination is this:
- Print profiling targets provided from the profiling software without any color management applied, so the color information in the printed targets is what the printer produces unaided by any adjustments.
- Calibrate the spectrophotometer.
- Use the Spectro to read the patches on the printed target.
- Use that read data in the profiling software to calculate the profile.
- Store that profile in the profiles folder of your hard drive.
- Use the profile in the print module of the software with which you will print the photo.
- Optional: Use the Spectro to read the printed patches of an evaluation target for seeing how closely the printer/paper/profile combination is reproducing the actual colour values of that target. I do this routinely in my paper/printer reviews and for my own work.
X-Rite’s current line of these professional hand-held instruments includes the i1Pro2 and more recently the i1Pro3 (and Pro3+). I recently upgraded my i1Pro2 to an i1Pro 3.
One of the most important differences between the i1Pro2 and the i1Pro3 is that the latter uses LED illumination, whereas the former uses tungsten lighting. LEDs are said to provide more consistent and reliable lighting. As well, the i1Pro3 has a sampling rate of 400Hz, whereas for the i1Pro 2 it is 200. This allows for double the input data that is averaged in an i1Pro 3 patch reading. Between the LED illumination and the higher sampling rate, X-Rite says that the i1Pro3 results should be more consistent and more accurate (relative to i1Pro2).
As the MYIRO-1 also uses LED illumination and is also a hand-held device for performing similar functions, it makes sense to compare the MYIRO-1 with i1Pro3, not i1Pro2. Therefore, that is what I do here. I shall first focus on the technical performance aspects of these systems and at the end of the story comment about the commercial side. I tend not to focus much on commercial aspects of the products I review, because the value is very much in the mind and wallet of the beholder. Especially when making comparisons, the different products have different features and operating conditions which would be appreciated and valued differently between different users.
There are two technical aspects to review: the instruments and the software. MYIRO-1 pairs with MYIROtools (Version 1.10 at time of writing), and i1Pro3 pairs with X-Rite i1Profiler (now in version 3.3.0).
Both companies are remiss on software documentation, X-Rite more so than KM. Both applications provide in-situ prompts of varying usefulness, but they are not a replacement for decent user manuals. KM does have a bare-bones online manual which I understand it will be improving, whereas X-Rite provides none, never has, and there is no indication it ever will. So, a “+” to KM for documentation, but it has a way to go if they can manage to do it. I must also thank KM for much-appreciated access to one of their management-level technical experts who provided valuable assistance on the use of both the instrument and the software.
(By the way, the most useful, recent detailed guidance I’ve found on printer profiling with i1Profiler is in Chapters 8 and 9 of Tom Ashe’s book “Color Management & Quality Output”, Focal Press, 2014. It contains good documentation of the profiling procedure and much more on a host of color management subjects.)
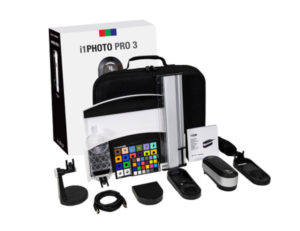
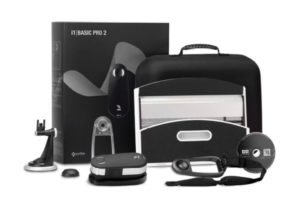
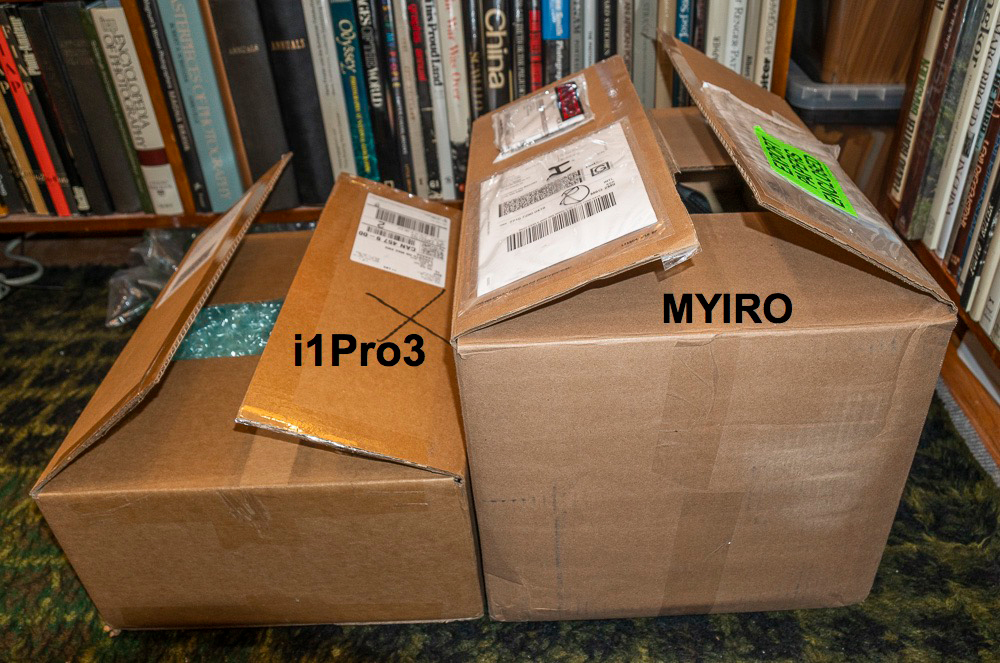
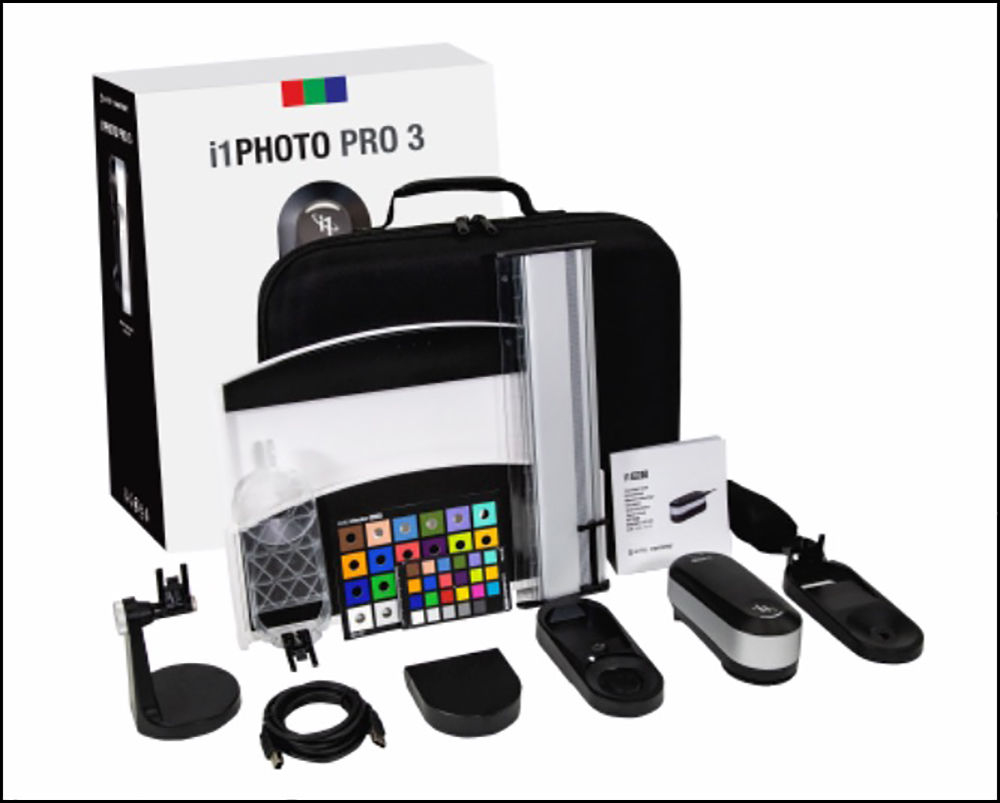
Let’s unbox these instruments and begin to explore. We are comparing what we get in a MYIRO-1 box with what’s in an X-Rite i1Photo Pro3 box. The MYIRO-1 box is about twice the size of the i1Pro box (Figure 1) and with less physical contents (Figures 2 and 3).
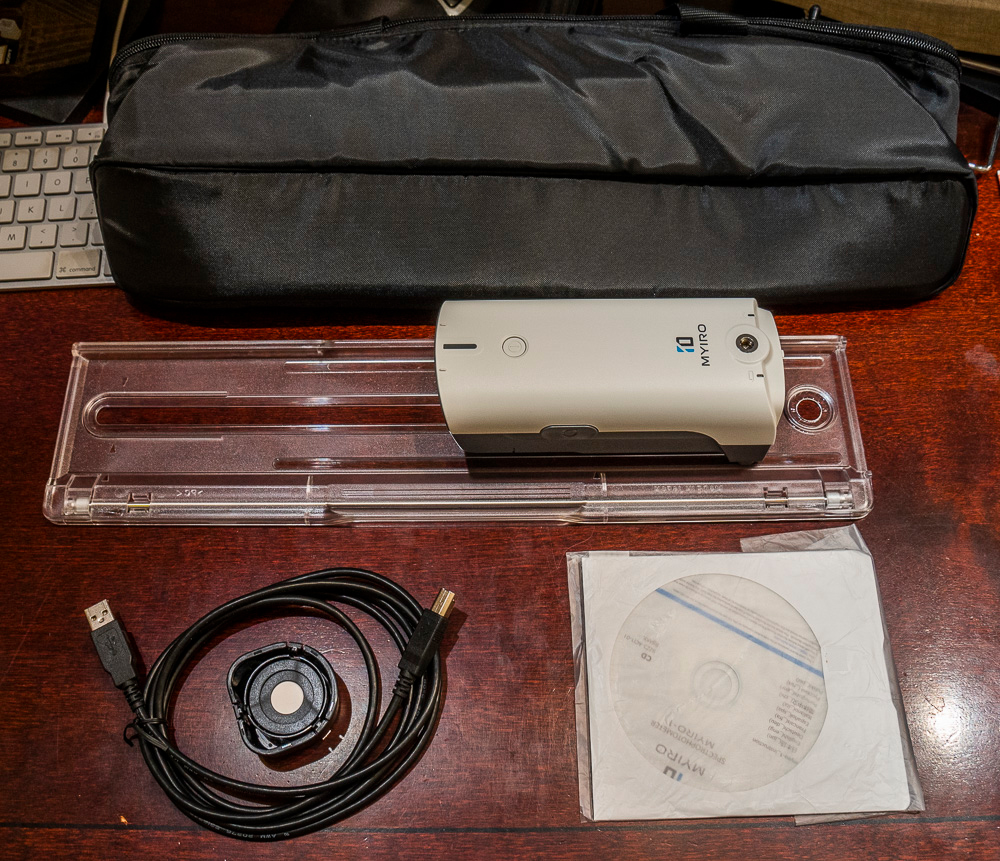
The MYIRO-1 box contains the instrument, a couple of application CDs (remember those?), a pliable carry case, a scanning ruler, a calibration disc, a USB cable, and if ordered – an optional ambient light measurement disc.
The i1Pro3 box incudes the i1Pro 3 spectrophotometer; i1Profiler (i1Publish) software for monitors, projectors, scanners, RGB printers; ColorChecker Camera Calibration software; PANTONE Color Manager software; ColorChecker Classic Target [mini]; ColorChecker Proof target; and i1 accessories (ambient light measurement disc, monitor holder, projector holder, scanning ruler, backer board, spot color positioning guide and carry case.
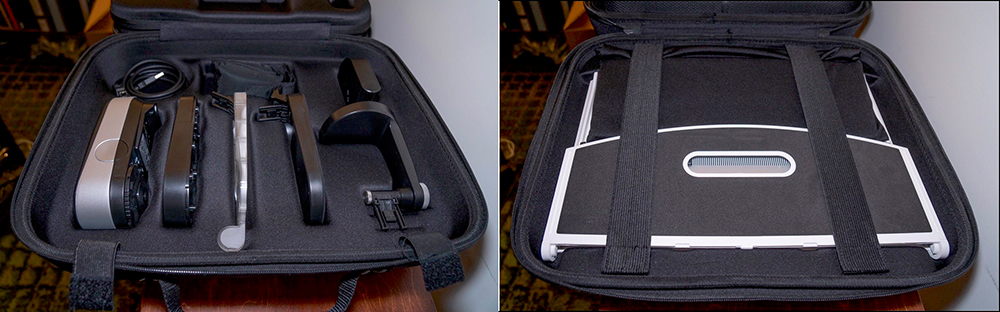
KM has very cleverly designed their product so that it needs several fewer accessories.
Backer Board: Firstly, a notable difference between the two packages is the inclusion of a backer-board with the i1Pro3 versus none with the MYIRO-1. What’s the importance of a backer-board? When measuring a printed target full of color patches, we need to place the target on something. The color of what we place it on influences the reading of the patches, because the paper is not 100% opaque and the light from the spectro is strong, so it can pick up some of the backing hue. Hence, it’s conceivable that we can introduce a color bias into the profiling just because of what we lay the target on. I tested this proposition using 24 patches of varying density, selected to allow the differential effect to show through to varying degrees using a “White” and a “Bluish” backer (Figure 5).
The two insets in the lower right of Figure 5 show the L*a*b* values of the “White” and “Bluish” backings without any target. Notice the much larger negative b* value for the “Bluish” one, indicating its clear color difference versus the “White” one. When the differences between the two sets of readings are calculated for dE(2000) – the numerical representation of the impact of the differences on a standard observer – the average of the 24 differences comes out to only 0.51, which indicates very little impact – on average. Individual patch results for dE(2000) range from 0.13 to 0.8, all below 1.0 and therefore in principle still below the threshold at which most people would perceive an impactful difference.

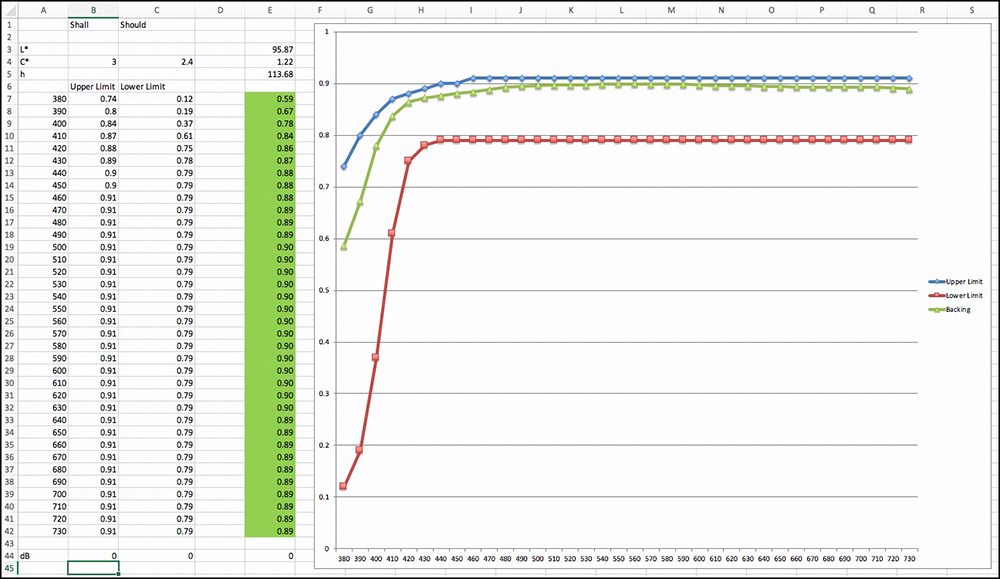
So maybe one doesn’t need a backer-board after all? It is the general recommendation to preserve as much neutrality as possible by using a white backing for reading profiling targets. Hence, KM is looking into developing one. But this is not an easy task. ISO standard 13655 defines the acceptable tolerances for white backing (Figure 6).
The spectral values (green line of Figure 6), should fall within the Upper and Lower Limits (Red and Blue lines) to be compliant. I measured the backer-board that came with my i1Pro3 and learned that it is out of compliance, but only for 5 positions on the spectral range (Figure 7) and not by much. I’ll still use it – I don’t think this is concerning.
Another advantage of the backer-board, at least the X-Rite design, is that it helps guide the movement of the ruler when scanning rows of target patches so that once positioned, the instrument is always in-line with the row being scanned.

Calibration Tile: Two other noteworthy design differences between these packages are the calibration tile and the positioning assist for making spot readings.
When starting a measurement task, the software will prompt us to calibrate the spectro. This is done by shining the spectro lamp onto the white tile of a calibration disc and letting the instrument calibrate itself. For the MYIRO-1, the calibration tile neatly tucks into the underside of the instrument, whereas for the i1Pro 3 it is a separate accessory on to which one lays the instrument (Figure 8). While not likely related to this factor, I find that the MYIRO-1 calibrates more quickly than the i1Pro3, but we’re talking about differences of some seconds. It also falls out of calibration between each task (by design), which the i1Pro3 usually doesn’t, so one may find oneself doing more calibrations with the MYIRO-1, depending on one’s usage.

Spot Measurement Assist: There are two methods for making hand-held measurements of color patches using a spectrophotometer. One is to scan an entire row of patches in a single sweep across the row; the other is to measure patches one a time, called spot measurement (Figure 9).
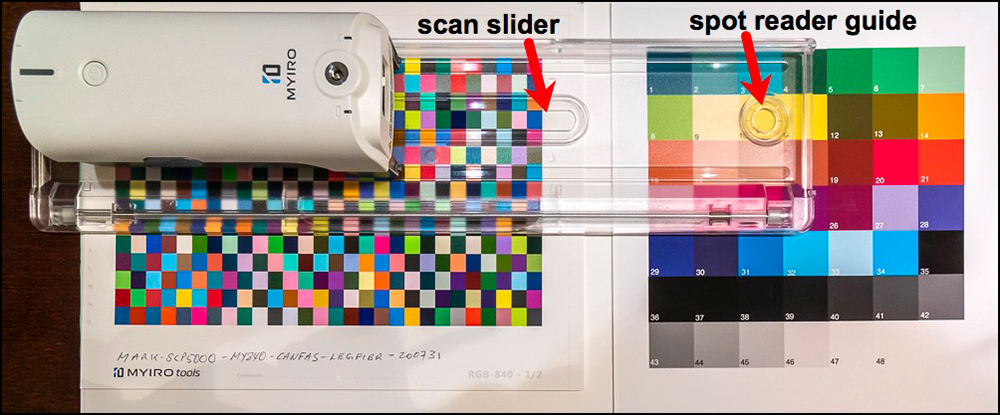
I1Pro3 requires two accessories: a ruler for guiding row scans, and a plastic clip for targeting spot measurements. MYIRO-1 combines both functions into one ruler, there being a slit for row scanning and a hole for targeting spot scans. Both approaches get the job done.
Ambient Light Measurement: The purpose of ambient light measurement is that the light surrounding a display influences how one perceives color on the display. By including an ambient light measurement in the monitor profiling process, one obtains information about ambient light that helps one decide what monitor brightness to use when creating a display profile. To measure ambient light, one needs to attach to the spectro a translucent disc through which the ambient light passes to be measured. This is included in the comparable X-Rite i1 packages but an optional accessory in the MYIRO-1 bundle. KM decided to make this an optional accessory because their research indicates that not many people use it, and its manufacturing cost is high due to the specially color-calibrated material that the disc is made of.
For monitor profiling, it is necessary that the spectro be held up to the display so that it can read the profiling patches that the profiling application flashes. X-Rite provides an accessory that holds the spectro to the screen. KM does not. The spectro includes a tripod receptacle allowing the user to place the spectro against the screen using a small tripod (Figure 10), or the spectro can be stood on its back-end against the display, using a prop if needed for height. So, the same function, different solutions.

Untethered: MYIRO-1 has a major advantage over the i1Pro3 in respect of handing: while the i1Pro3 needs to be tethered to a computer, the MYIRO-1 can operate untethered over a wireless LAN. It suffices to configure the device with the appropriate network settings (Figure 11). This is achieved using the instrument connection dialogue in MYIROtools.
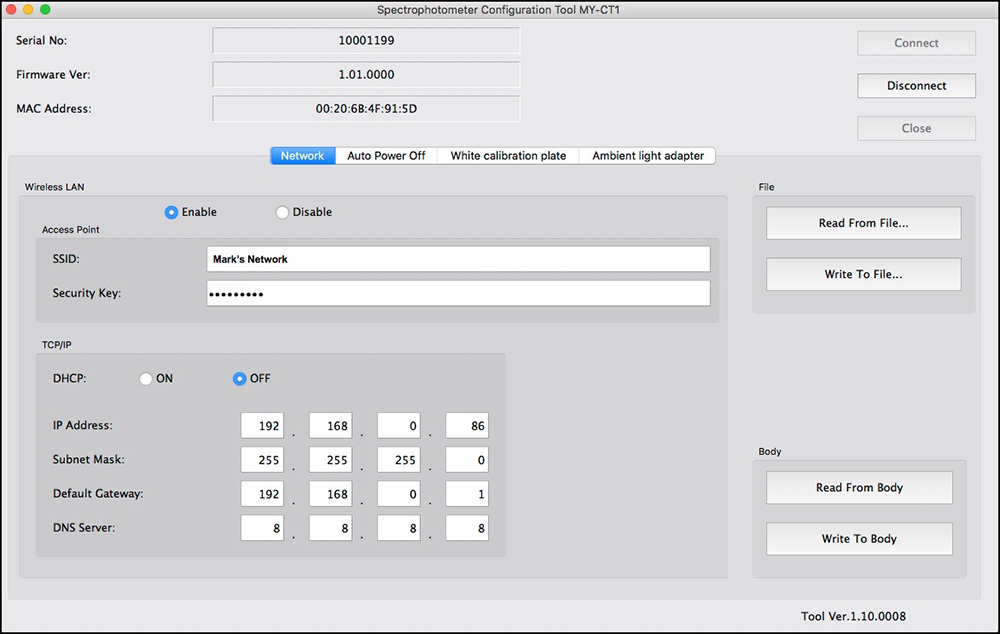
Normally this should be an easy process, like setting up an iPad or an iPhone to connect with a network. However, the MYIRO does not automatically pull-up available networks, so one needs to type in the network name, and of course the password, the technical terms in their interface for these two bits of information being the SSID and the Security Key. Once that is done, the LAN settings should automatically populate the set-up screen. My experience was that this didn’t happen for reasons we could not detect. We resolved it by turning off DHCP and giving the device a fixed network setting (Figure 11). Once set-up, untethered use over the LAN is reliable and very satisfying – no cables to contend with.
Handling of OBAs: There is an under-the-hood specification difference between these instruments possibly worth knowing about for some peoples’ purposes. Numerous inkjet papers contain optical brightening agents (OBAs). Paper tends to be grayish unless either bleached or treated with OBA compounds during manufacture. The latter are cheaper than the former. OBAs work by absorbing UV light and projecting back a bluish energy that makes the paper look brighter and cooler. This transformation happens at a spectral wavelength of 365nm. In order to measure how much of a blueing effect the OBA will have, and for the profiling to automatically neutralize it, the spectrophotometer needs to be capable of reading what happens at 365nm. The MYIRO-1 reads from 360nm, so it can do this. The i1Pro3 reads from 380nm so it cannot. Instead, X-Rite provides for a separate Optical Brightener Compensation tool in i1Profiler and a piece of cardboard with varying hues of gray allowing the user to perform a manual visual adjustment procedure. While on this subject, I should just offer that these OBAs fade with exposure to light and ozone causing an often uneven yellowing appearance as the paper reverts to its natural hue. One can avoid all of this by using papers that don’t contain optical or fluorescing brighteners.
So much for the most important comparisons of the hardware packages. I turn now to the software: firstly, to licensing which is critical to software functionality and differs between the packages in important respects.
Both KM and X-Rite provide different levels of software licensing that allow for different levels of functionality, that is, the things we can do with the software and the spectro. Correspondingly, the cost of the system differs depending on what level of functionality the user wants to have.
A primary, for some perhaps important, distinction between the MYIRO and X-Rite packages is what the license is tied to. For MYIRO, it is tied to one computer and one back-up copy on one other computer. I1Profiler has no such restriction, as the i1Profiler license is tied to the spectro. The software can be used on any computer that the i1Pro instrument is plugged into.
Both applications have featured-based versions of their applications, but the nature of the distinctions is different between them. MYIRO offers two levels of licensing: demo, which enables only measuring and viewing data, and a perpetual license allowing indefinite access to all application features.
I1Profiler can be used differently according to whether one buys the Basic, i1Photo or i1Publish packages and they become costlier as you progress up the line. The hardware is the same for all three, but the kind of profiling allowed differs depending on the package. I1Basic allows display profiling, i1Photo Pro allows display and RGB printer profiling, while i1Publish adds CMYK printer profiling.
All of us using only inkjet printers managed by OEM RGB-based printer drivers don’t need CMYK profiling, which is meant primarily for profiling CMYK presses; however, if the inkjet printer were managed through a RIP, CMYK profiles become necessary. Our inkjet printers are called RGB devices (even though they use CMYK inks) because their drivers receive RGB colour data, hence for most of us, if buying X-Rite, the i1Photo Pro would suffice. If buying MYIRO, the MYIROtools license provides both RGB and CMYK profiling – one doesn’t get to choose availability of only RGB; hence, in terms of the kind of profiling it allows, it is more comparable to X-Rite i1Publish Pro than to i1Photo Pro.
Both applications do not allow holders of non-commercial licenses (the kind most of us buy) to sell or give profiles made with their software to 3rd parties. The wording and scope of the restriction in the MYIROtools EULA is ambiguous, while X-Rite’s EULA spells out the user’s very limited rights with respect to 3rd party provision in detail. The key legal factor here is that the companies consider the profiles that users make with their licensed software to be associated to the software, conferring upon them the right to impose licensing restrictions.
Using the Applications
A number of applications these days are configured to work either as a collection of individual tools doing single tasks which the user selects in whatever order at will, or as “workflows” which guide the user through a pre-ordered sequence of steps to get the job done. For the latter, some applications allow the user to preset the options desired within each workflow step, obviating the need to use individual tools (SilverFast 8 and basICColor Display 6 and Input 6 are good examples of this approach.)
MYIROtools provides the user the option to use tools with or without structured workflows. I1Profiler is workflow-oriented. For each task, there is a defined sequence of steps that light-up as each one is selected. I need to resist the temptation to write a manual here that would detail the differences between each, so instead I’ll comment on key differences and demonstrate the approach of each for two main tasks both applications provide: Profiling (always scanning rows of patches) and spot measuring.
There are some key differences between the applications for measuring and profiling.
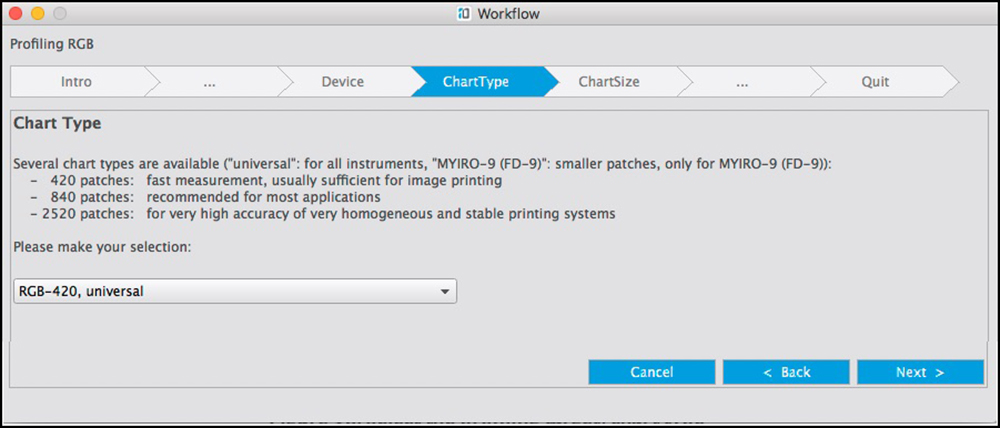
(1) Configuring targets: MYIROtools comes equipped with three profiling targets: 420 patch, 840 patch and 2520 patch targets. As of now, there is no provision in the software for configuring and adding other targets. I1Profiler allows the construction of an indeterminate number of profiling targets of different sizes up to 6000 patches.
(2) Saving Printable profiling targets: It is best that the profiling targets be saved in TIFF format for printing if one intends to print them outside the profiling application, as is necessary for MYIROtools (but not i1Profiler, see just below). MYIROtools is supposed to provide their targets in TIFF format, but I could only find them in PDF format, however KM did provide them to me as TIFFs and I expect to see them in the next software up-date. I1Profiler allows one to export the targets to one’s preferred folder in TIFF format.
(3) Printing Targets: one can print profiling targets from i1Profiler but not from MYIROtools. The advantage of printing the targets from within the application is that – at least in i1Profiler – it allows for printing without colour management, which is essential for this task. One can also print TIFF format profiling targets using the Adobe Color Print Utility (recommended for Epson Printers), Print Studio Pro (recommended for Canon printers) or Apple ColorSync (MacOS), but i1Profiler provides the convenience of doing it right from the profiling application.
(4) Error control: When scanning profiling targets, it is necessary that the patches one scans are the same as the ones that the application target layout expects. With i1Profiler, if you scan the wrong row, say miss a row, or make other mistakes scanning a row, the application warns you immediately, it produces a flashing red light on the spectro, alarm beeps and an error message stating what you did wrong and you rescan. It will only accept a correct scanning of the correct row relative to the target and it shows how the scanned values compare with the reference values (Figure 12). The upper triangles are the colours of the reference values, while the lower triangle in the same patch is the colour of the value the spectro read from the printed target patch chart. The bottom row of Figure 12 is what the row looks like before being scanned. The user can easily see and match the colours in the screen target with the colours in the printed target to make sure the correct row is being scanned. The procedure is essentially “idiot-proof”.
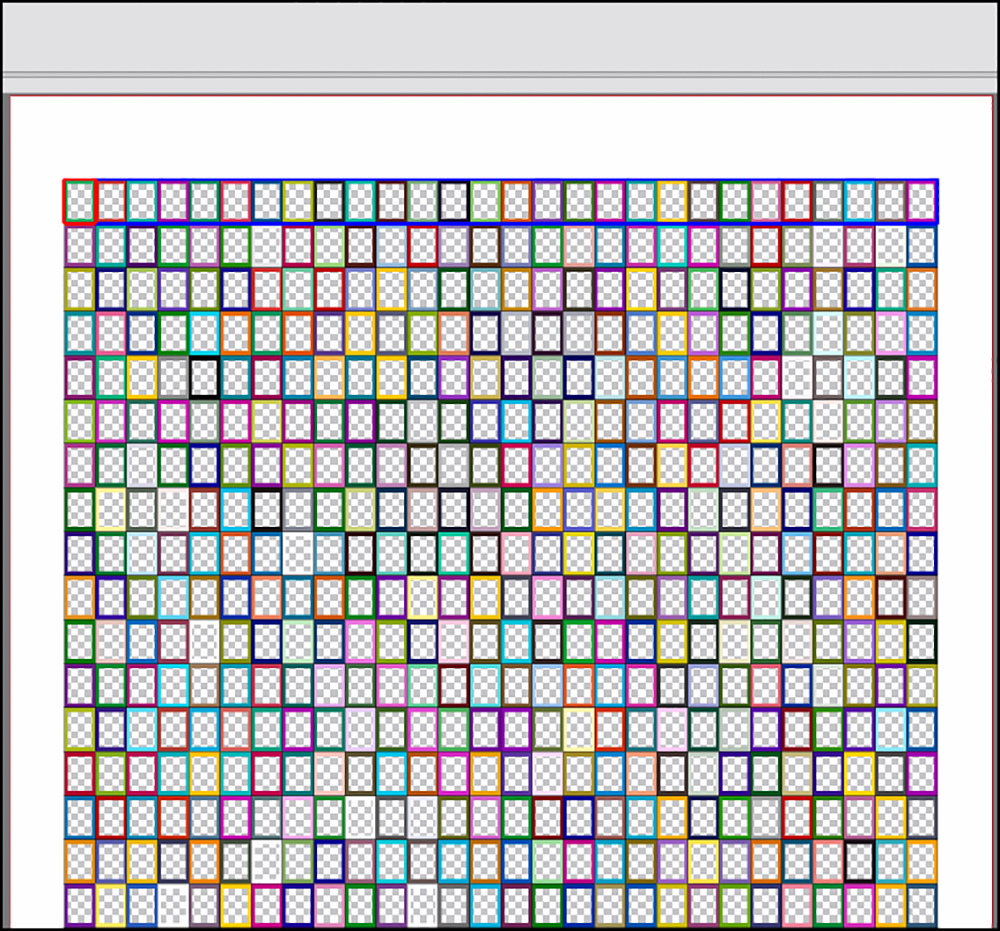
MYIROtools is less “idiot-proof”, as a result of which some mistakes are incorrectly described, or worse, aren’t flagged when they happen, so you can pass through the whole scanning before seeing anything went wrong, and if you try an “illegal” pastiche of some kind, end up with profiles that look quite “artistic”, but in less polite language, are totally screwed-up (Figure 13 where due to pilot error (my mind wandered because, after all, scanning patches is a mindless task!) a row of patches was skipped and a wrong row substituted, versus Figure 14 – what a well-formed profile looks like when everything is done correctly in the same application). While some people may not want their software and instruments barking at them, sometimes it’s really useful.

Part of the difficulty with MYIROtools is that it isn’t very easy to identify whether one is scanning the correct row, because the patch colour one should be reading is not so obvious (Figure 15, compared with bottom row of Figure 12). Notice from Figure 23 below it does indicate the row letter to be scanned next, but that disappears when the row is scanned, and the row identification letters on the printed target are extremely weak. Bottom line: if you remain very focused between the screen and the target and not lose track of what you are doing, scanning is smooth and successful. KM is aware that the “fool-proofing” aspect of the scanning process may deserve improvement and will be looking into it.
(5) Profile-making options: A number of profile-making settings are not available in the current version of MYIROtools that exist in i1Profiler. MYIROtools is limited to V2 profiles whereas the ICC recommends using V4. For RGB profiling, MYIROtools gives us the choice of RGB Standard or RGB Vivid. I1Profiler has options to adjust contrast, saturation and gray neutralization balance. For the profile’s A to B and B to A tables, in i1Profiler the user can select Large, Medium or Small, and 8 bit or 16 bit granularity. In i1Profiler we can adjust profile smoothness, select between four chromatic adaptation models, select between ICC version 4 or version 2 profiles, and there are four options for setting the White Point. KM advises me that in their view a number of these features have no practical benefit, but a number of them will be included in a forthcoming “advanced” version of MYIROtools.
(6) Saving of measured data: For these instruments, measurement and profiling data can be saved in three measurement conditions: M0, M1 and M2. Measurement Conditions concern whether the paper contains optical brighteners (OBAs) and whether one wants to include their effect in the profiling measurements. M0 and M1 include OBAs, M1 is specific to D50 illumination, while M2 excludes OBAs (also known as “UV-cut”). Both spectros measure for all three conditions in one pass over the row, so in neither case do we need to rescan the target in order to make a separate profile for each Measurement Condition. The retention of this information happens automatically for all three at once in both as well; however, the manner of saving-out (if you want to) and accessing the process for commissioning profiles of differing Measurement Condition differs between them, the procedure being arguably somewhat simpler in i1Profiler – that said, if both had intelligible documentation of the procedures, users would find either manageable.
(There is a fourth Measurement Condition – M3 – which measures with polarized illumination. In this condition, the spectrophotometer is fitted with a special polarizing filter. I have previously discussed M3 profiles elsewhere, so I don’t repeat all that here, save to say that for matte papers it can enhance black tonal appearance and highlight detail. MYIRO-1 is not capable of M3 profiling and neither is the i1Pro3, but X-Rite does provide a more expensive i1Pro3Plus which can do so. It is not relevant to this comparative review.)
Neither application is a paragon of eye-pleasing design. MYIROtools harks back to a kind of 1990’s Windows 3.1 look. i1Profiler uses tiny white font on black background, an eyesore, and has buttons placed here and there with no apparent logic. Both could use a good overhaul by usability specialists. MYIROtools workflows can be awkward for back-stepping, whereas this is straightforward in i1Profiler.
Summing-up on software differences, it is fair to say that MYIROtools has fewer features and options than i1Profiler for making profiles and measuring charts, but KM assures me the application is under continuous development and features will be added. Notwithstanding these differences, in terms of process and results, both applications become increasingly usable with familiarization and they get the job done.
Making a Profile:
To properly show you the operational differences between these two applications, I’ll walk through the RGB Profiling Workflows for both.
We begin with MYIROtools and the MYIRO-1. In the Figures below I have scrunched the screens to be smaller than they are in the application, because they contain a lot of empty space we don’t need here. I’ll make a 420-patch profile, for speed.
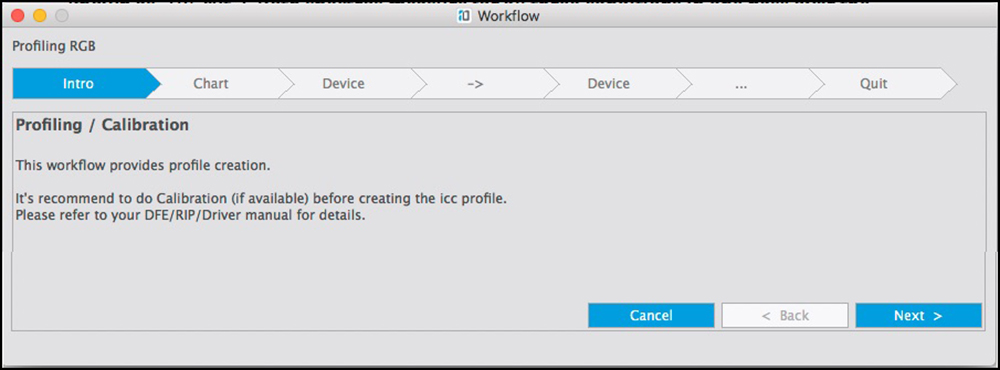
1. The application home page, workflow selector:

(Upper panel for individual tools, lower panel for workflows)
2. Calibration Reminder (The wording of the message doesn’t quite say what’s intended – it’s a reminder to make pre-profiling adjustments as available, for example, printer linearization where available):
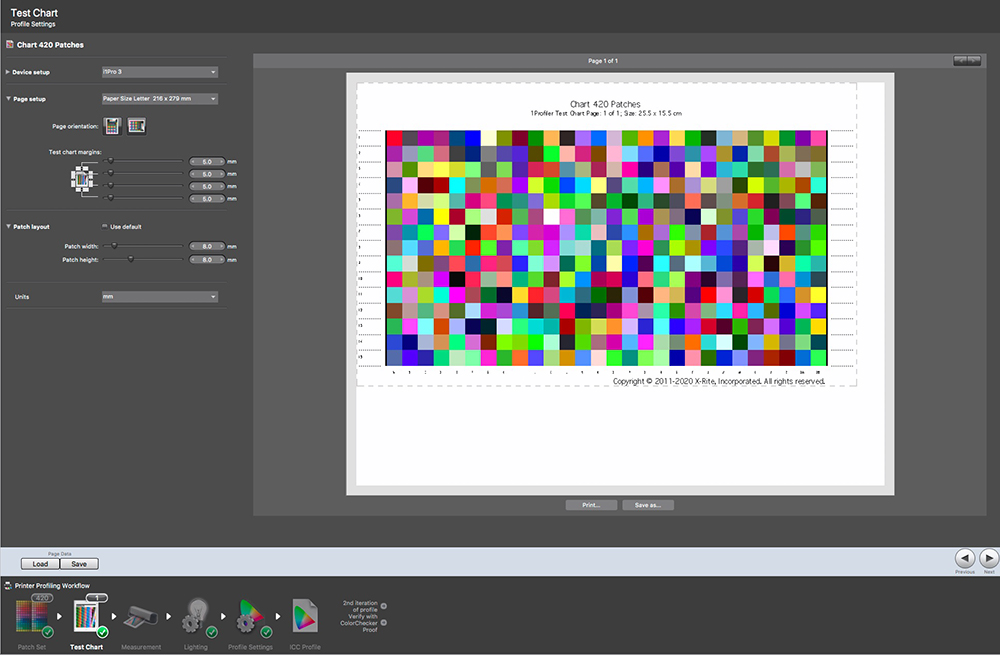
- Select the Page Size and Target Chart:

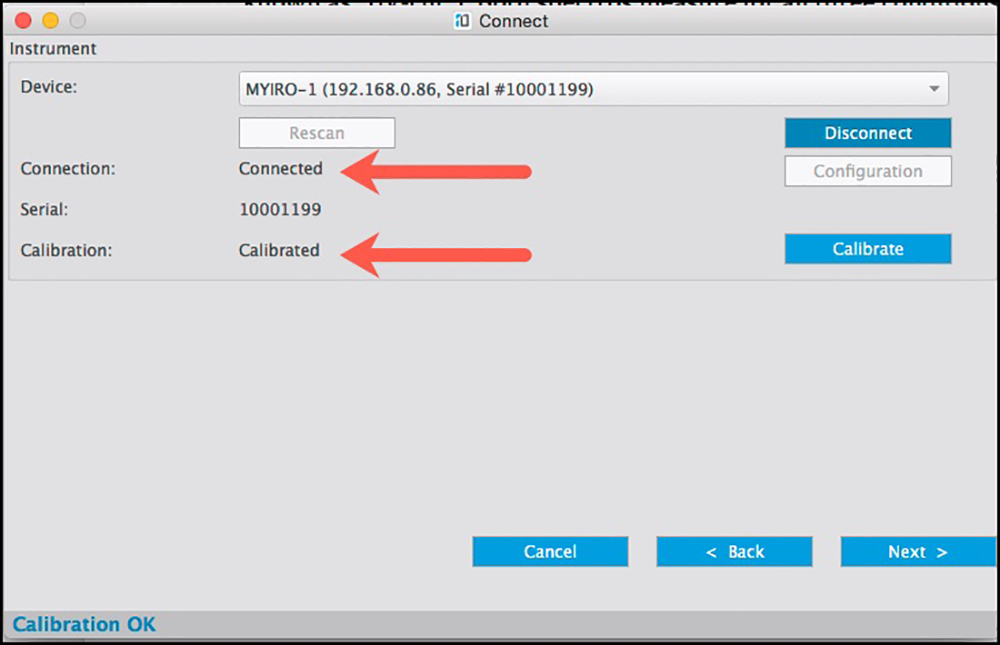
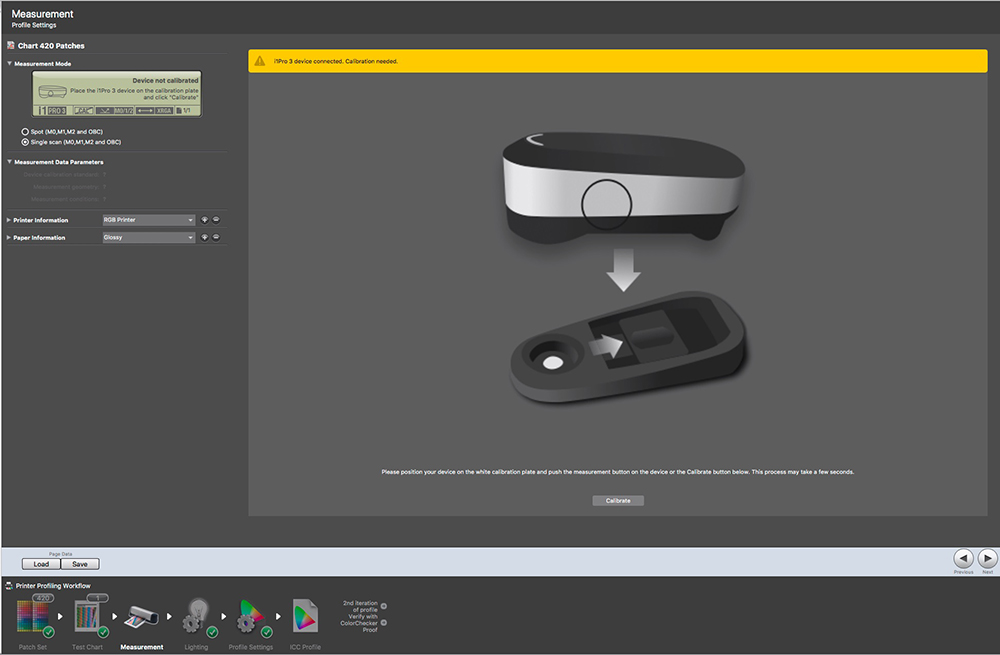
4. Connect and Calibrate:
5. Selection of Chart Type:
(This screen could be combined with the screen of Figure 18)
6. Select Chart Size: This is for selecting how many pages to use for printing the target, where there is a choice. This screen could also be combined with selection of the Chart Type – it’s part of the same story.

7. Target Print Reminder and Move on:
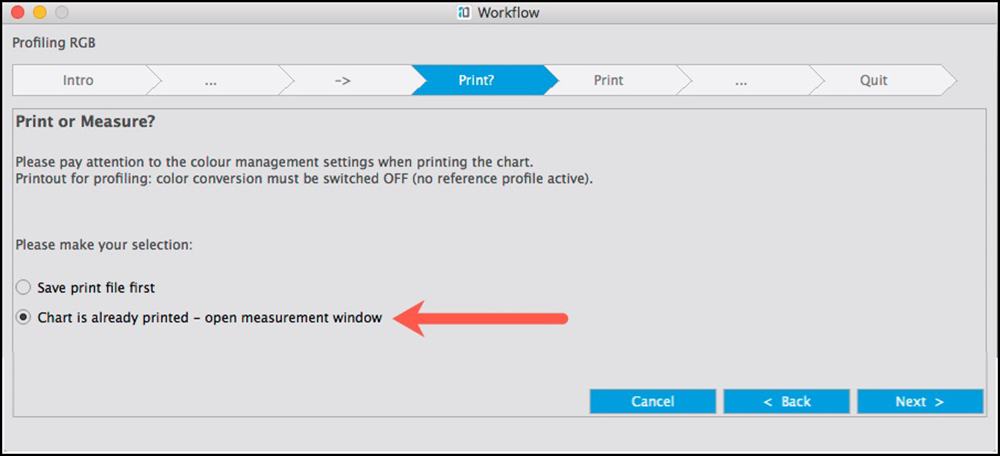
(The only option now is to have the print ready. Select “Next”.)
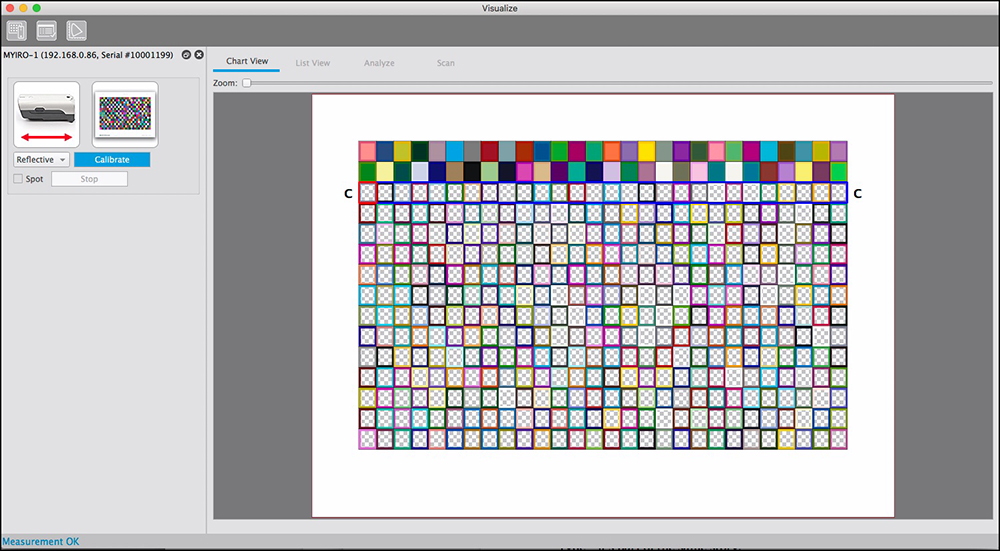
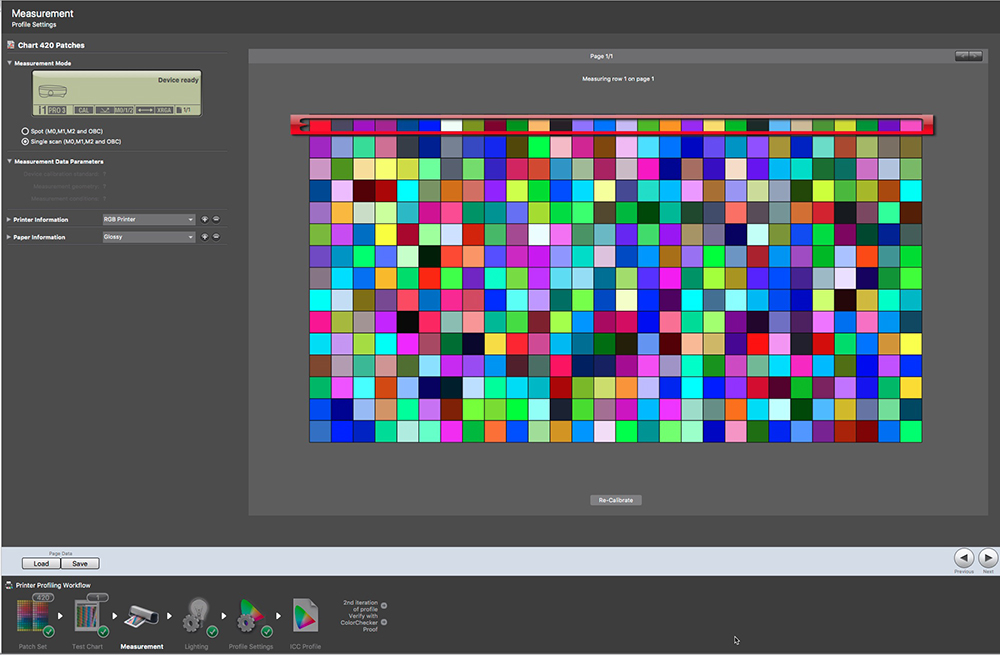
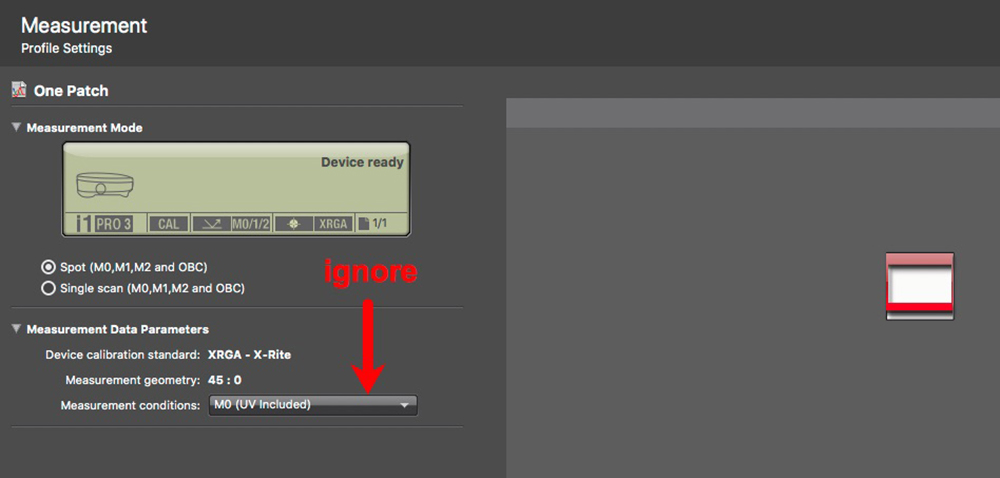
8. Measurement Screen comes up:

9. Scan the rows of patches:
10. Select the Measurement Condition:
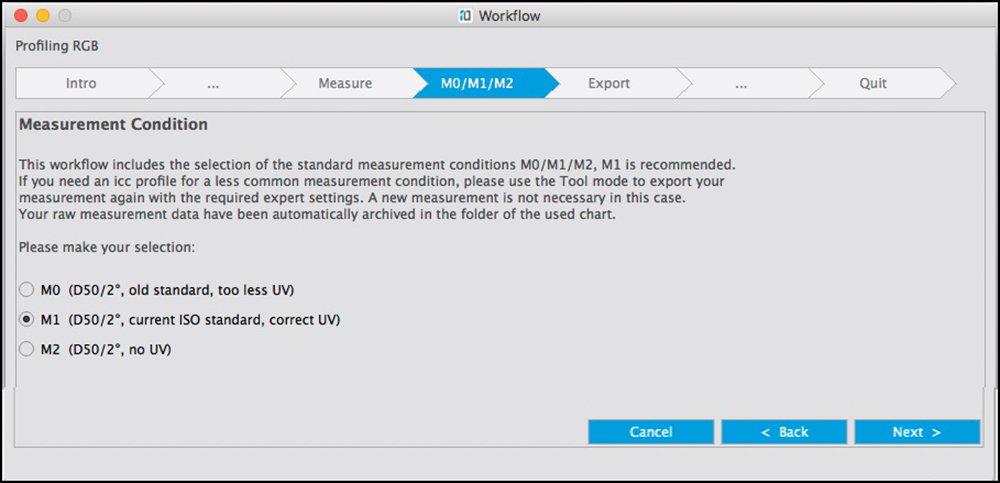
(The instructions could be clarified but boil down to the advice to save the data if you think you will need to use it for an alternative measurement condition.)
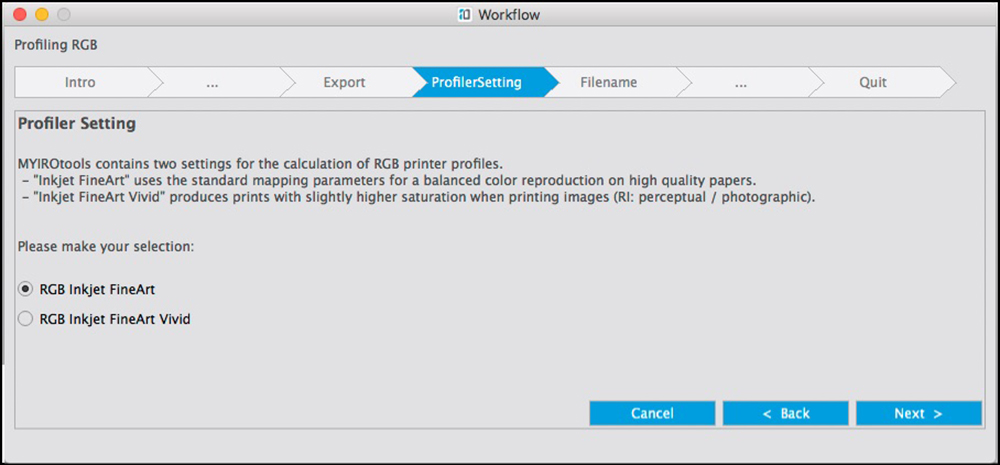
11. Select whether you want a standard or Vivid profile (normal recommendation: use Standard).
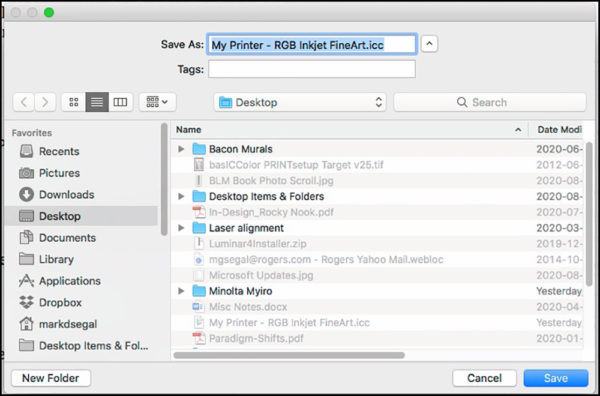
12. Name the profile and choose where to save it (the default should be your Profiles folder in the Operating System and User Library, not what I show in Figure 27, which is a trial run-through!).
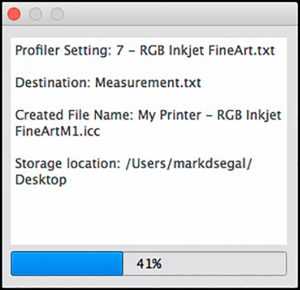
13. Results: Tells us if the profile was made successfully:
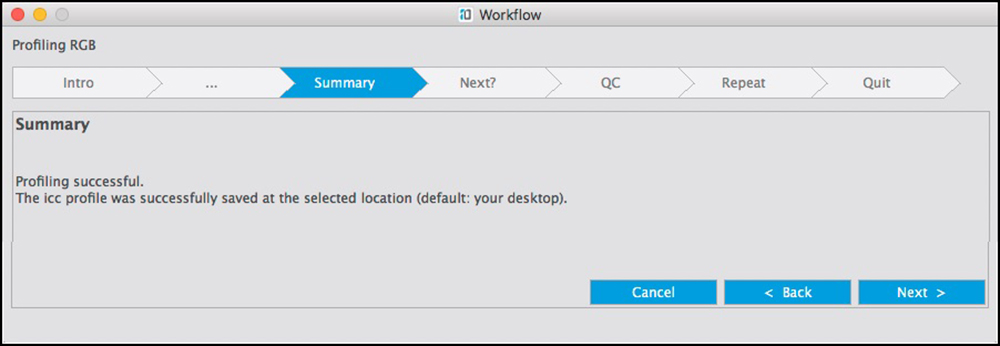
14. Next Steps are to repeat the profile, go to Quality Control, or Quit.

I’m selecting to Quit here because I shall be discussing Quality Control later in the article.
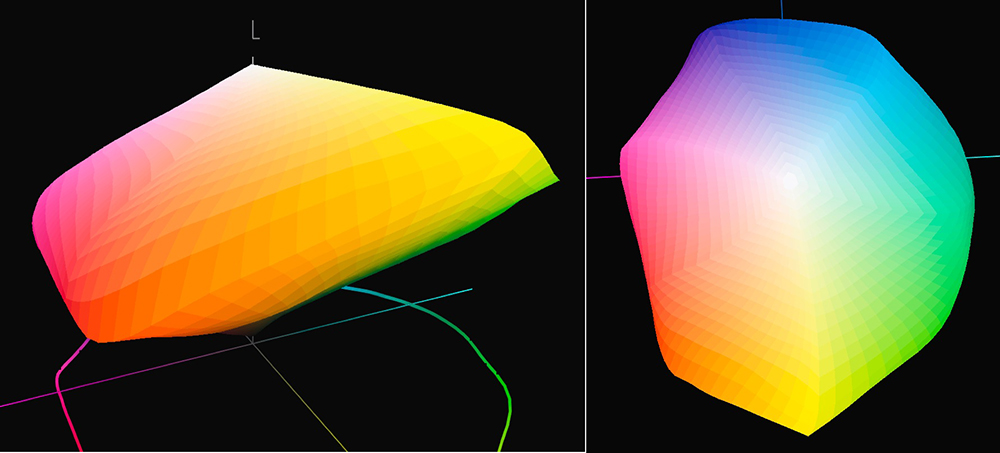
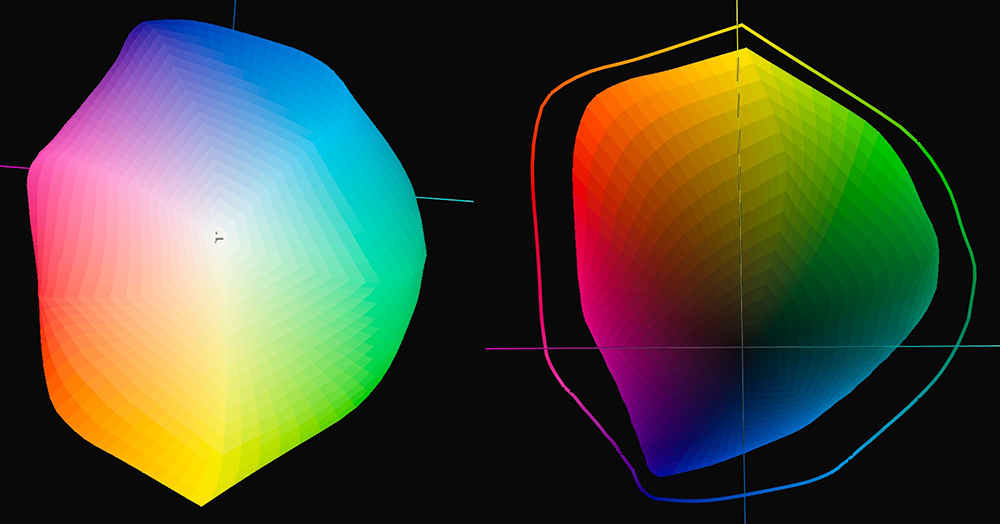
Observed in ColorThink Pro, this profile looks well shaped and smooth (Figure 30). I’ll be covering comparative profiling results in detail after I finish reviewing the processes.
Making a Profile with i1Profiler:
1. Connect the spectro and open i1Profiler (Figure 31):
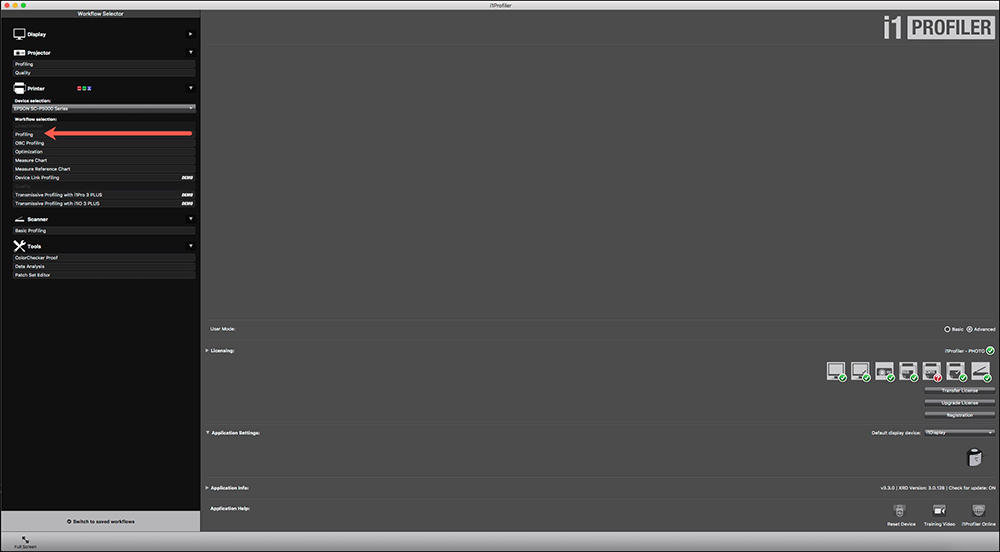
2. Select Profiling. (See red arrow in Figure 31).
3. Define the size and style of the patchset for the profile target (Figure 32). I’ve constructed a 420-patch target to mirror the one made in MYIROtools. I’ve chosen “scrambled” patches because this may help the spectro avoid potential reading errors.
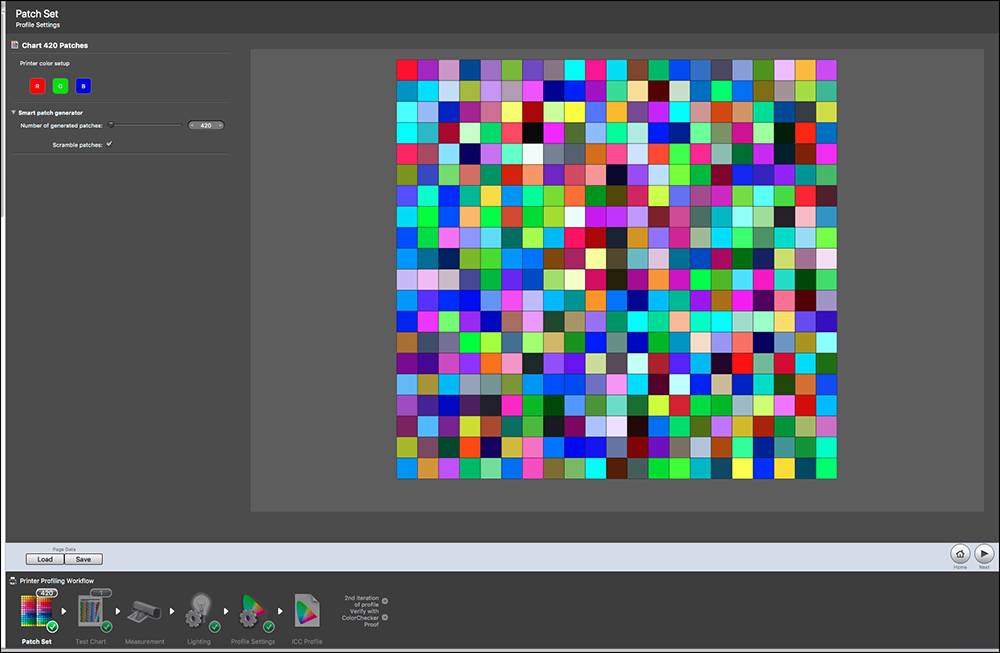
4. Define the page set-up for the patches (Figure 33). There are choices of page size, margin size, patch size, page orientation, and this is the stage at which one can print and save the target in TIFF format. I did both.
5. Calibrate the spectro.
6. Measure the patches. The chart patch colors are very prominent, making an easy visual match between what one sees on screen and on the printed target being scanned.
7. After measuring the patches, I click on Save Workflow (lower right) which saves all the settings and scanned patch data achieved up to this point. This is highly recommended in case of a computer failure – it can all be retrieved easily from the Saved Workflows list at the left side of the screen (Figure 36 – I have been omitting this list in previous screen grabs). The information I surrounded with a red rectangle is not operational. The scanning and saving make separate files for all three measurement conditions at one time. Select the measurement condition (M0, M1 or M2) wanted for the profile. To change the measurement condition, pull-up the workflow, go to this tab, and select another one, then proceed with the subsequent steps.

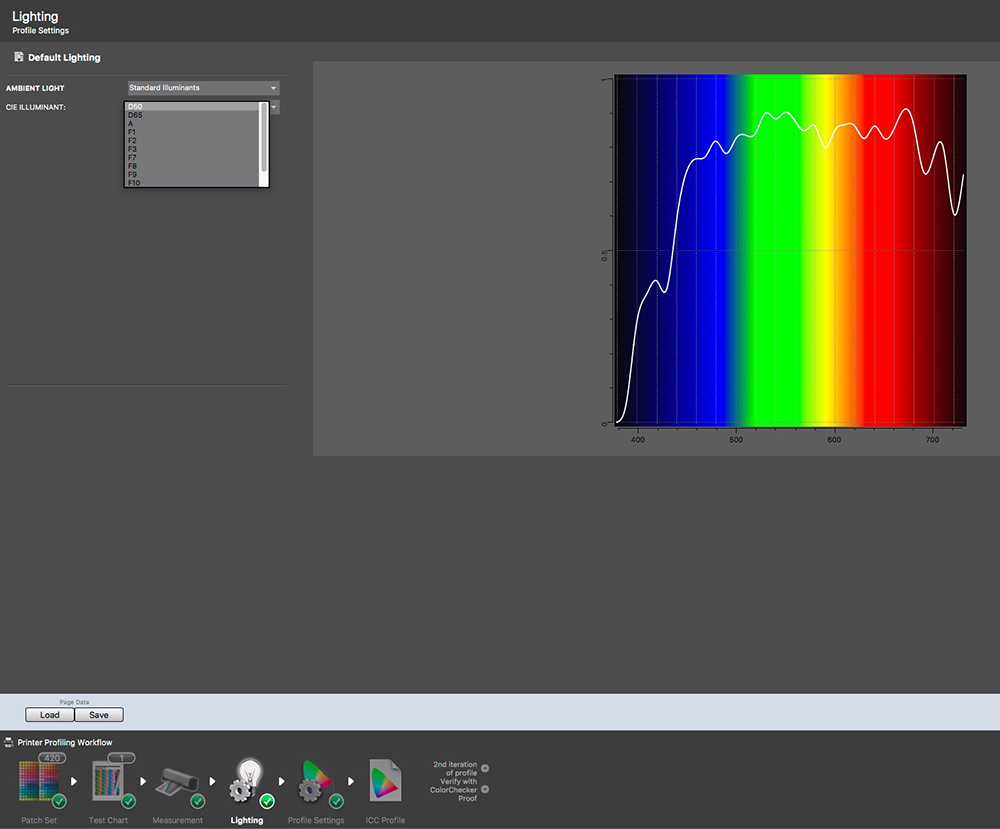
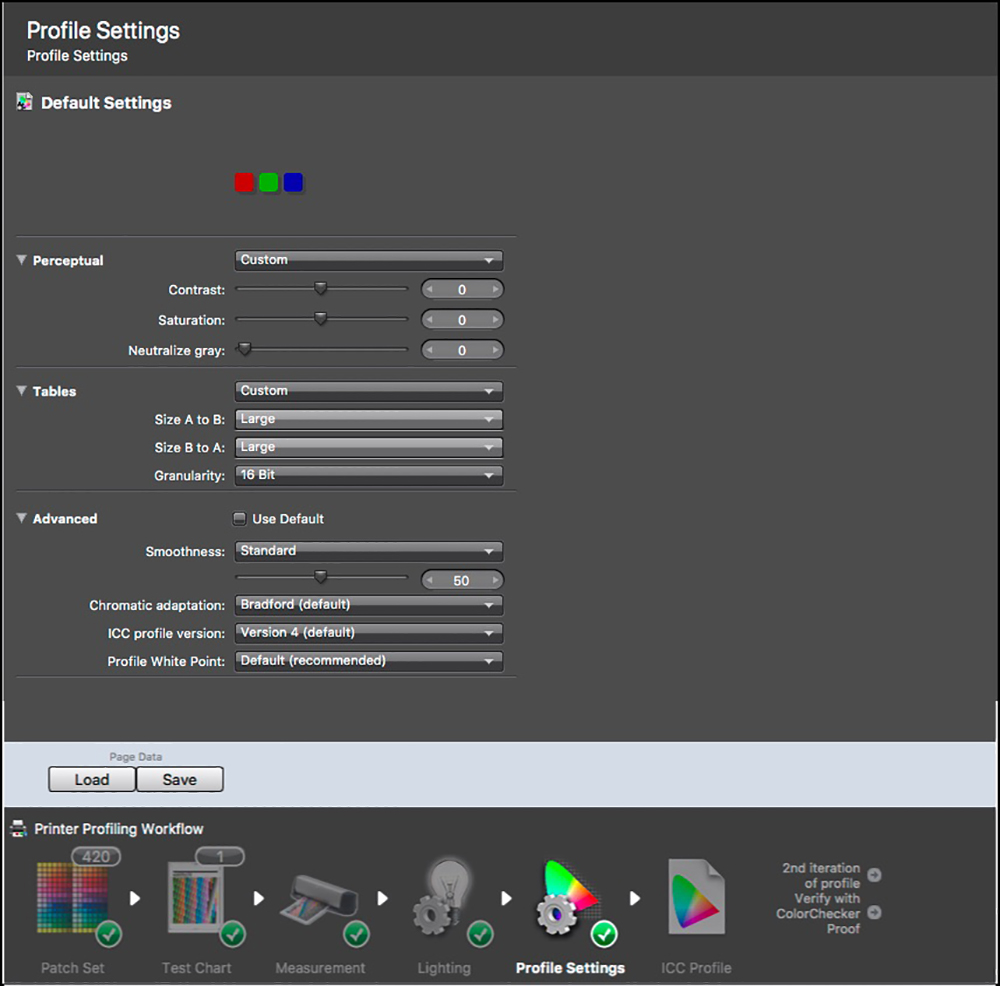
8. Select the kind of lighting most appropriate relative to print viewing conditions.
9. Select the profile settings (Figure 38). Quite a few options are provided which could influence the character of the profile. (I have not experimented with all of them so I can’t be more specific about the effects of these choices.) After doing so, it is wise to resave the workflow, which will now include the latest settings. This is because the next step is calculating the profile, and, rarely, there can be application failure here from which recovery is faster and easier if all the data heretofore is saved in the Workflow. One always wants to avoid the need to remeasure charts of patches.
10. Calculate the Profile (Figure 39). Here is where to create a profile name, choose where to store the profile – one can store it in two places at once, and start profile calculation. The storage information is sticky. I always store profiles in the Profiles Folder at both the System level and the User level. This way they are readily accessible to any application using such profiles.
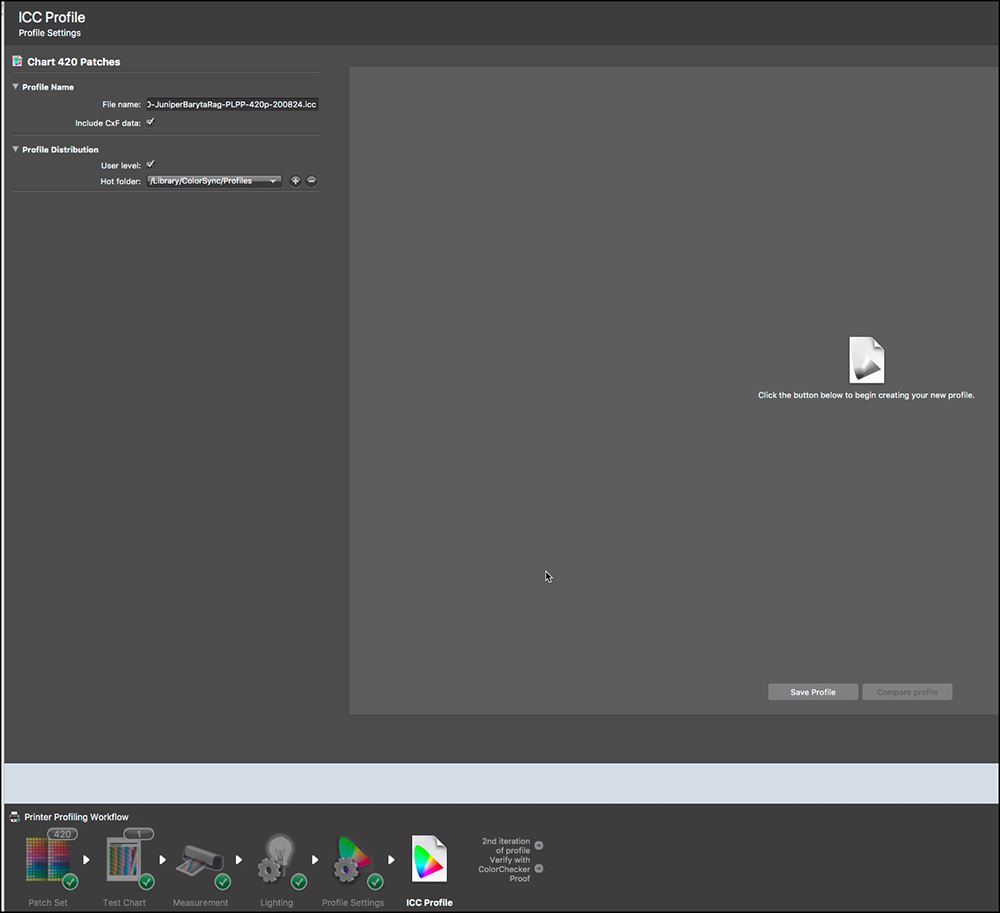
11. Once the profile calculation (Figure 40 area in red rectangle I inserted) finishes, i1Profiler provides an image of the completed profile (Figure 40). I prefer to use ColorThink Pro to inspect the profile at this stage (Figure 41).

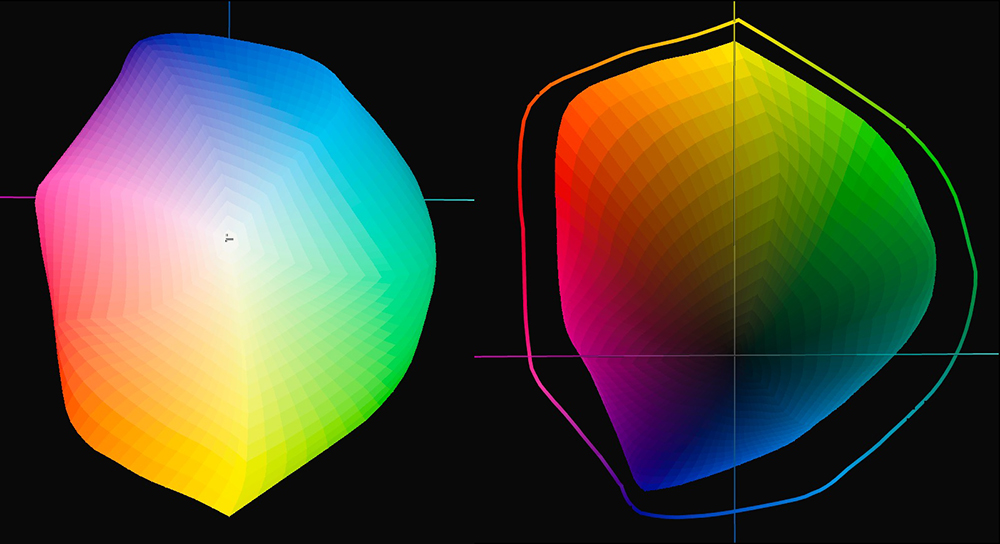
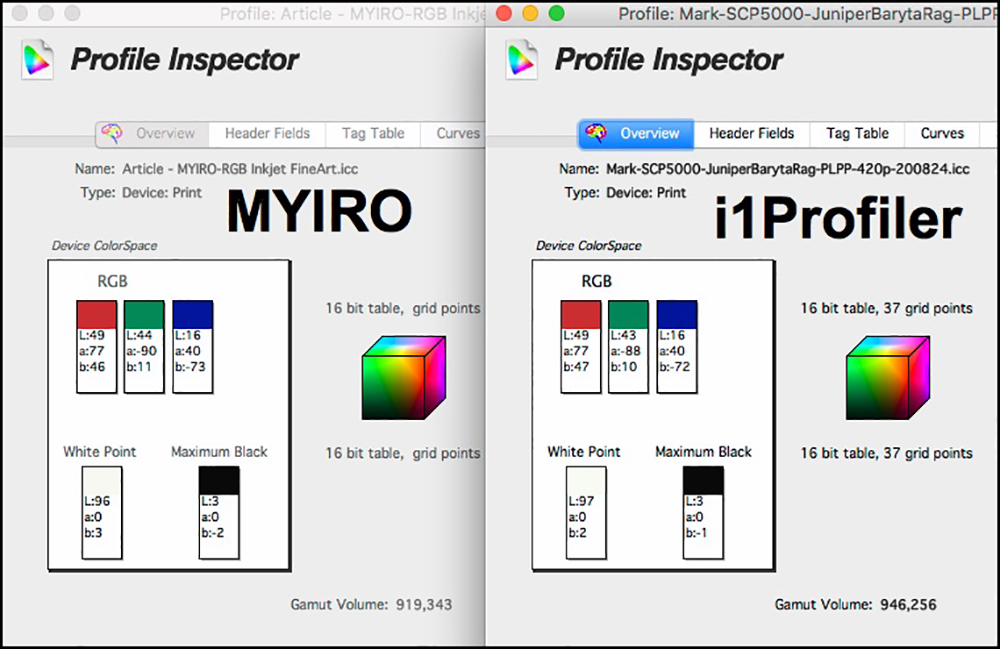
In this example, i1Profiler produced 2.9% greater gamut volume, which would be insignificant in just about any print. Otherwise, the data for these profiles is very similar (Figure 42).
There is provision for profile verification at this point, but I consider it rather lame and much prefer using my own test suite for this – it’s far more granular and informative.
Measurement Function
The next major function I’ll compare in this review is how each application handles the creation and measurement of targets not intended for profiling. I make extensive use of such measurements for my own paper/printer/profile evaluation suite.
In this function too, there are large differences between MYIROtools and i1Profiler. Let’s begin exploring how MYIROtools handles measuring targets.
1. The process starts at the same application Home Page shown Figure 16. Except this time, we select the Measurement Tool. At present, the Measurement Workflow is not useful for us inkjet printer types, because it leads to the selection of only one chart type that most people outside the pre-press industry would not use most of the time. Upon selecting the Measure Tool, the screen appears asking us to connect and calibrate the spectro, as in Figure 19.
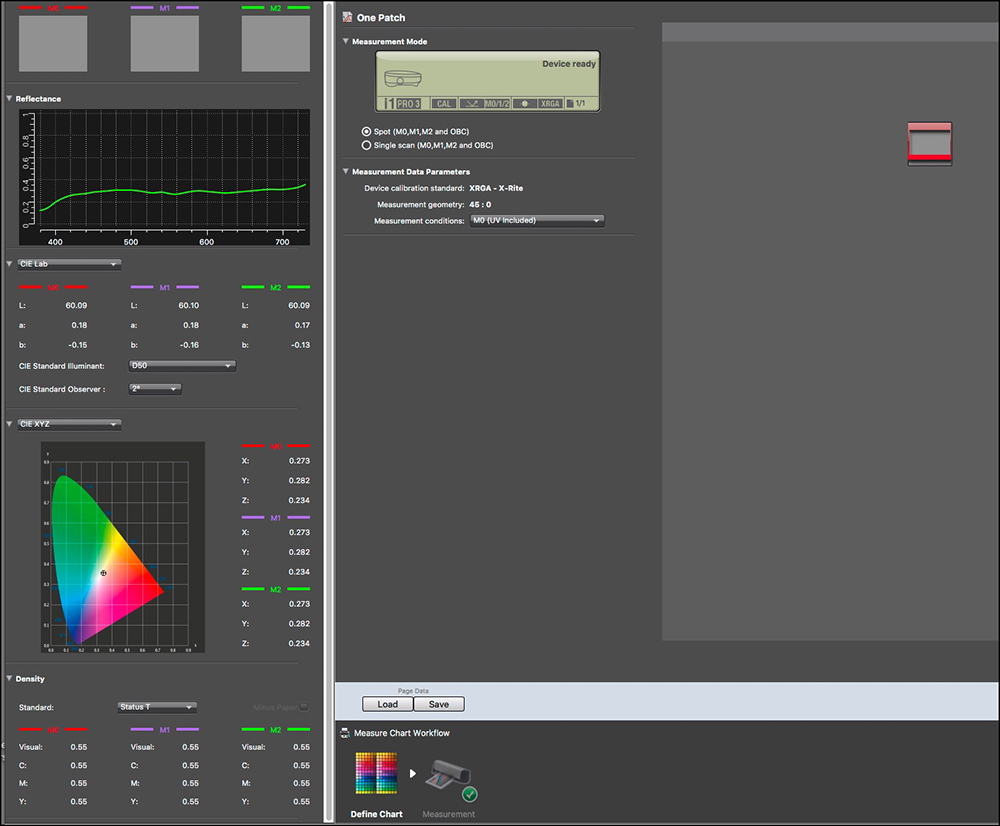
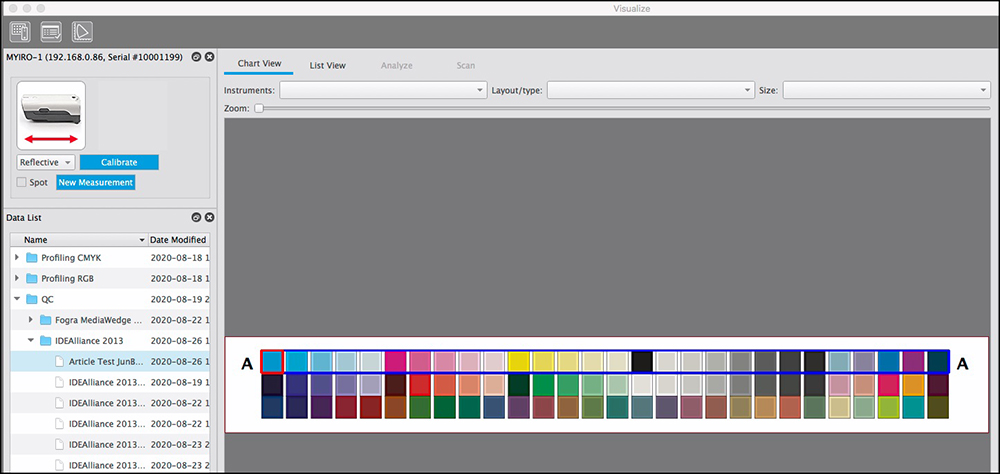
2. After connecting and calibrating, the “Visualize” screen appears (Figure 43).
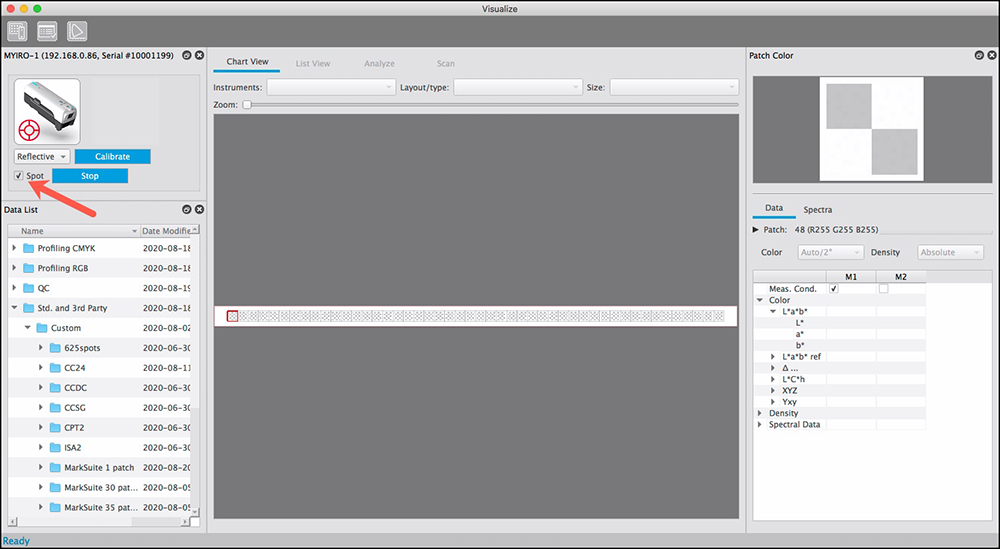
This screen provides access to most of the measurement formats provided with the application, the remainder being in the QC (quality control) section. As we’re not using it for profiling or QC, we select the Standard and 3rd Party group and within that group, there are a number of possible chart formats to select from. The left side contains the access links to the files, the center is the working window and the right side shows the data for each patch as it is scanned, in quite a few formats, which is handy. I’ll demo this just below.
Unfortunately, MYIROtools does not provide a way for users to generate their own measurement chart formats. This is supposed to come with a future version. But one can use some of the provided versions, provided the number of patches in the target format is larger than required, and stop the measuring process when finished measuring one’s own number of patches. KM did me a favor of creating several measurement chart formats, one of them being for just one patch. This does come in handy. So, Figure 44 shows the measurement of a patch from my own profile evaluation target print (using the above-created profile) that is supposed to be 60,0,0 (L*a*b*), and as you see, the result came out as 59.4,-0.01,-0.37 which is close to the reference value of 60,0,0 – so it’s good.
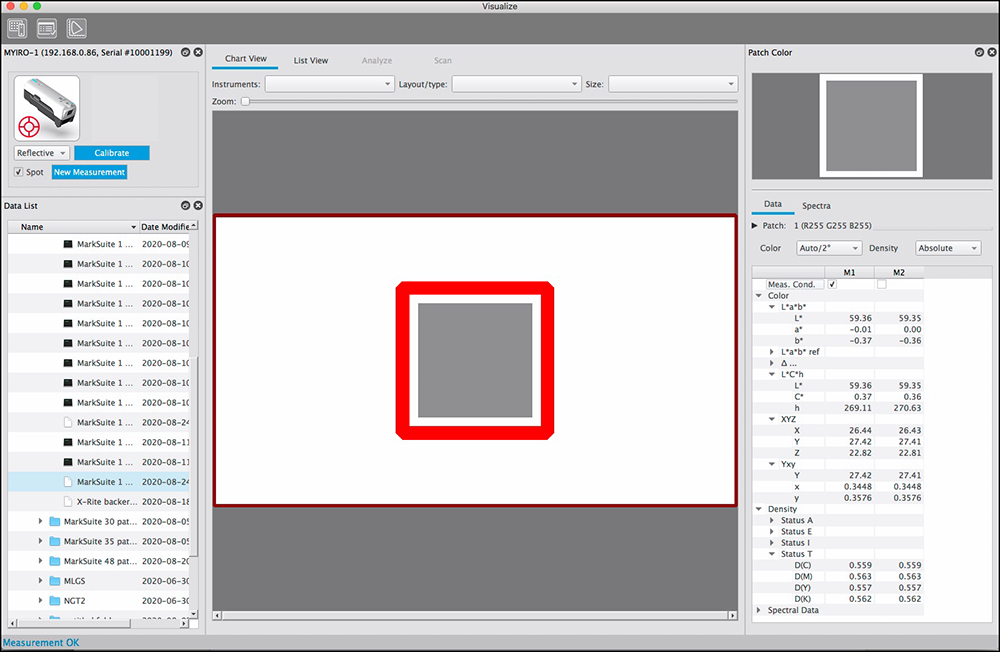
Figure 44, right side, also shows the many types of color measurement information provided for that one patch, which comes up automatically upon measuring it. This is nice functionality.
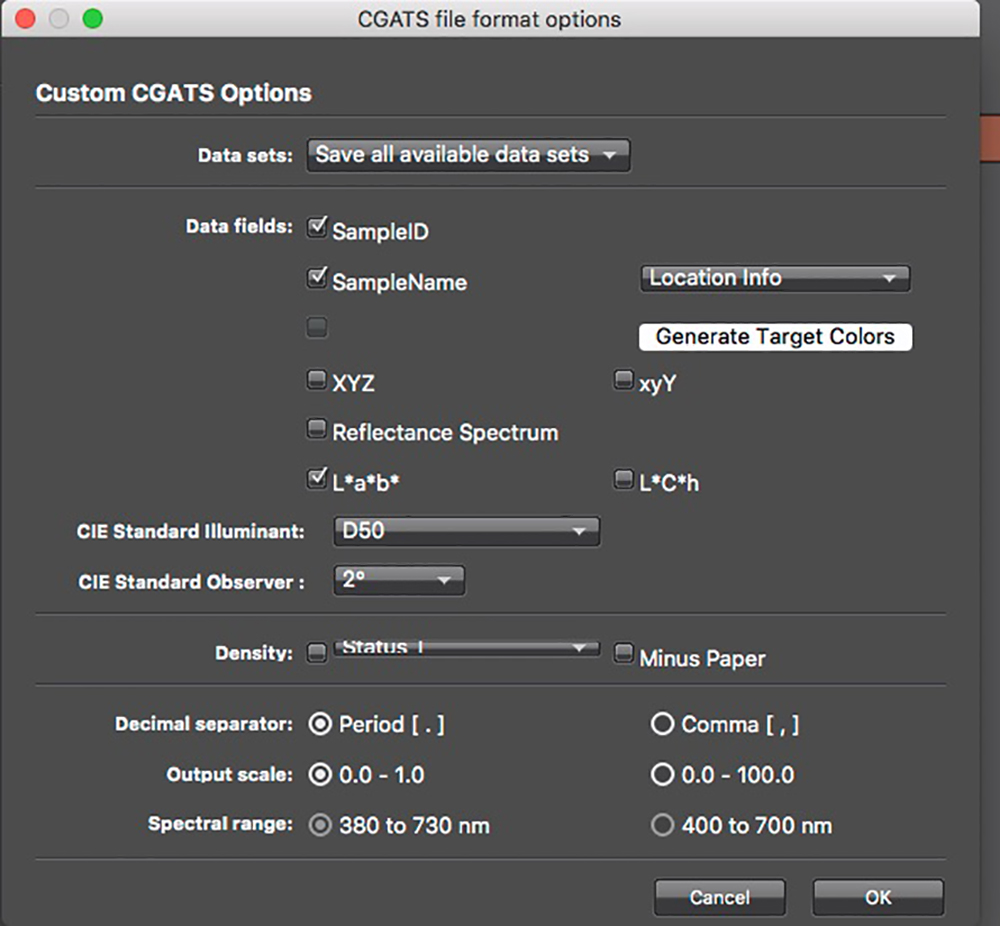
The measurement data is automatically saved in the MYIROtools working folder (left side), but if you need to rename it or export it for use in other applications, and this is totally counter-intuitive hidden functionality, one needs to right-click the file name in the left panel, whereupon options will appear to rename and export the measurement data.
By clicking on the Analyze tab while in Visualize, one can do a QC (accuracy) check against a variety of international industry-standard control wedges (Figure 45). This is primarily for CMYK press proofing workflows; I’ll touch upon it later.

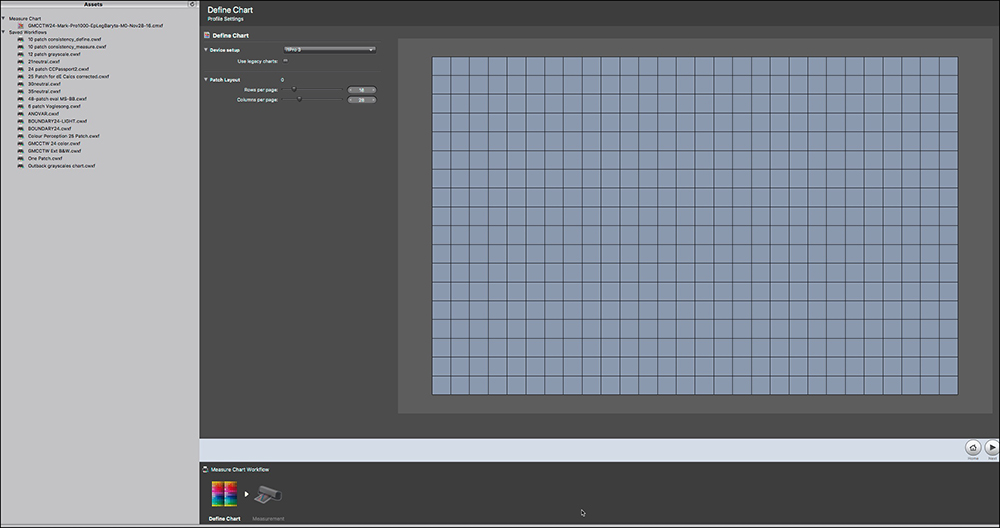
I turn now to chart measurement in i1Profiler. We’re back in the Home Page of i1Profiler, where I select Measure Chart (Figure 46).

1. The first thing i1Profiler does is present us with a screen for configuring the number of rows and columns in the chart of patches that we will measure (Figure 47). Once an arrangement is configured, we can save it as an asset for future reference. These assets are displayed in the left panel of the interface. Every chart configuration I need for my profile evaluations is saved in that column, so when I reach this screen all I need to do is select the one I want to use. Just for now, I’ll select the “One patch” chart as I did for the MYIRO.
2. Once done, the Calibration screen comes up. I select spot measurement and calibrate the spectro.
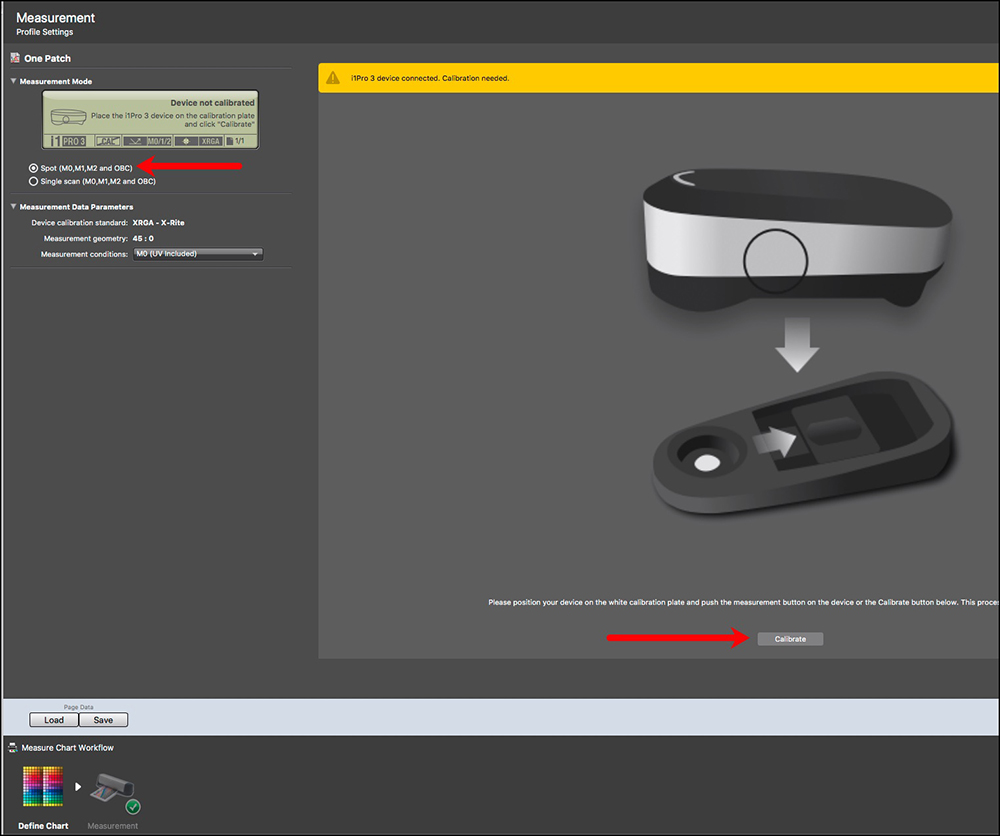
3. Once calibrated, the measurement screen appears. Attach the plastic spot measurement clip to the spectro and click on the patch(es) to be measured. Then I save the data in all three Measurement Conditions at once with one click regardless of what the Measurement Condition pane says. (Figure 49).
4. Once the measurement is made, the same kind of information provided in MYIROtools is available here in i1Profiler, but to access it, one needs to double click the measured patch of interest, and all the measurement data is populated in a column to the left (Figure 50). Here, for example, we see that the patch which is supposed to measure L*a*b* 60,0,0 actually measures 60.09,0.18,-0.15 (M0), which is very close to the reference value – i.e. it’s good.
5. I then Save the data in a folder of my choosing using Save options that i1Profiler pulls up before making the save (Figure 51). These values are then saved automatically in three separate files as M0, M1, M2 data sets for further reference.
In a nutshell, both applications measure and save data similarly (main difference being that saving for M0/M1/M2 is one operation in i1Profiler and three in MYIROtools; the look and feel are different between them, as one would expect.
Quality Control (QC)
Much of the software, hardware, and literature for QC is aimed at the large and important pre-press and large-scale print production industry, working with CMYK offset printing presses and large-scale commercial digital print processes. Both MYIROtools and i1Profiler support this function.
This is an involved topic deserving (more than) a whole article of its own, so I shall confine myself to a very brief sketch of the basic QC process and the capabilities provided. I should add that documentation on using these modules in both applications is non-existent – the companies are of the view that the people who need this functionality know how to use it. But I must re-emphasize, in case they are listening, the absence of documentation is maddening.
QC essentially concerns whether a print or a contract proof meets the relevant industry association’s criteria for acceptable color accuracy of printed output, generally based on ISO Standard 12647-7. It does this by having the user include with the printed output a control strip consisting of patches of colors (including grays), so the control strip gets printed under the same conditions as the print is made. It is then measured for differences between the printed color values and the reference values of its color patches, which vary depending on the printing condition being tested – there are a number of them.
Three of the major industry associations providing for official QC are Japan Color, FOGRA (based in Germany), and IDEALLIANCE (global, headquarters in the USA). Each produces a control strip – the Japan Color Control Strip, the IDEALLIANCE Control Wedge 2013, and the FOGRA V3 Media Wedge. Their materials include the color patch targets and the reference values of the color patches in those targets for each of the printing conditions that have been characterized. These associations have also developed the standards and procedures for determining whether a print process complies or not with their criteria for acceptability using their control strips. Software supporting them include the evaluation algorithms for determining whether a process complies with the criteria on a pass/fail basis. Figure 52 shows the FOGRA and IDEALLIANCE control strips.
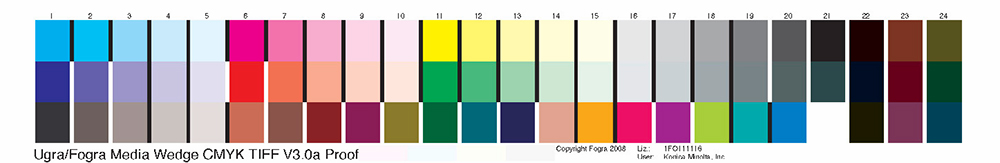

There is a large amount of informative literature about these processes and procedures on the FOGRA and IDEALLIANCE websites.
MYIROtools and the MYIRO-1 presently support these evaluation procedures for both the FOGRA and IDEALLIANCE standards. KM does not provide a license for the Japan Color control wedge. Hence, the user needs to have this license in order to print it. MYIROtools can measure it.
I1Profiler also includes these materials; to access them one plugs-in the spectro (enables the license) and in the home screen select “CMYK Printer”, otherwise there is no access to the QC files or process (Figure 53).
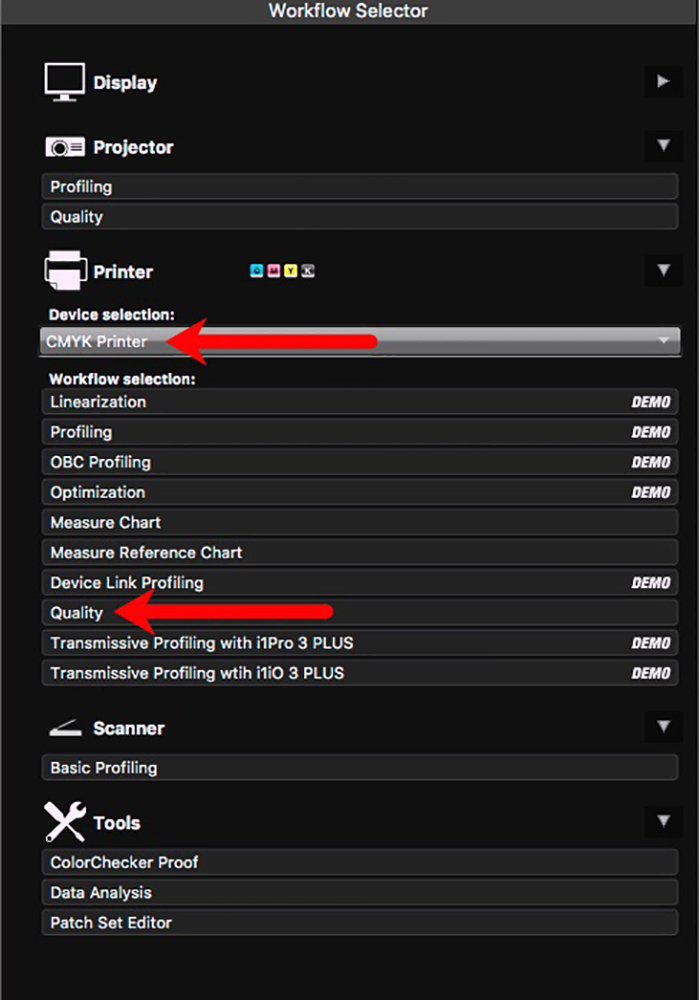
Now let us do a quick run-through of the procedure in i1Profiler using the IDEALLIANCE wedge and CRPC-6 reference values, which correspond with the GRACOL 2013 print standard. (GRACOL = General Requirements for Applications in Commercial Offset Lithography.)
1. Select the “Quality” workflow (Figure 53, lower arrow).
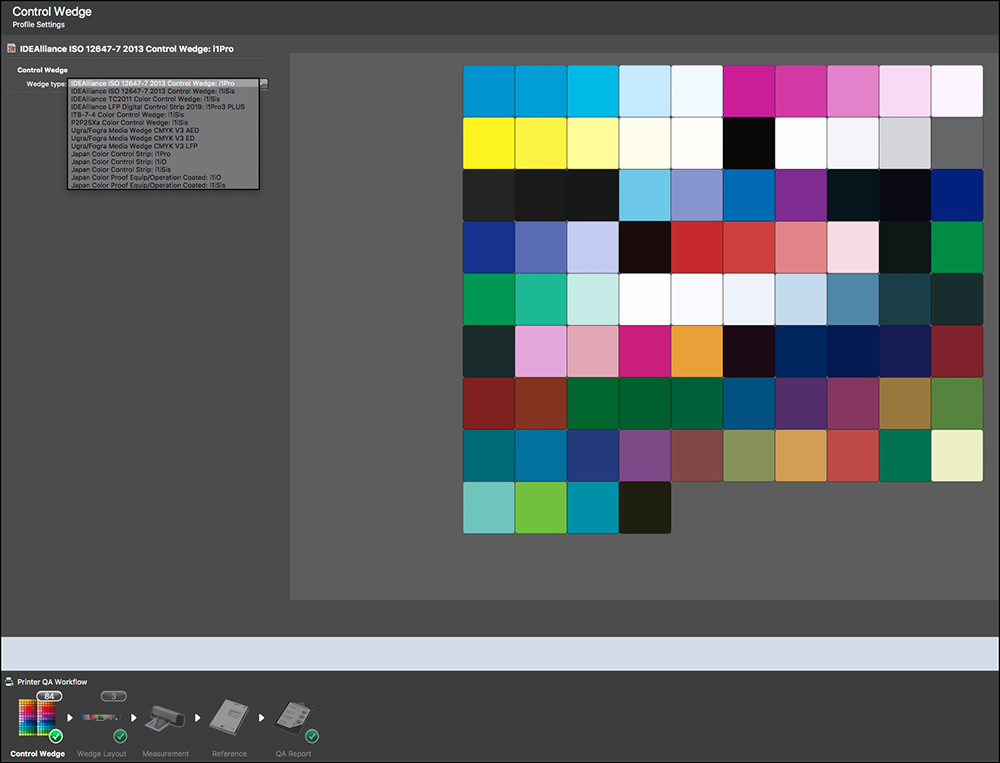
2. The workflow opens; select the IDEALLIANCE Control Wedge (figure 54).
4. Move on to “Wedge Layout”, where the format of the strip to be scanned is represented (Figure 55). One needs to have printed the control wedge using the same profile and other printing conditions as those for which the profile was created.

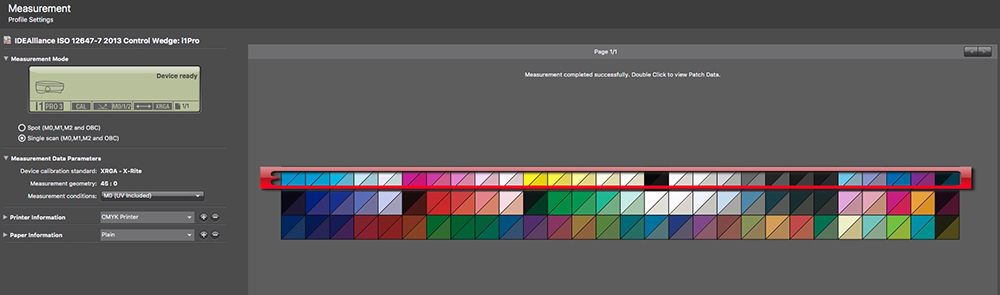
5. Click on Measurement. This target can be scanned in strip mode, only three rows, so it goes fast. Once the measurement is complete, a picture of the scanned patches will resemble Figure 56.
6. Click on Reference (bottom workflow toolbar) and select IDEALLIANCE CRPC-6 as the reference file (figure 57).

7. Click on “Report” (workflow bottom toolbar), hold your breath – it won’t take long, and the results pop-up (Figure 58). As you can see in the left side panel, it failed.
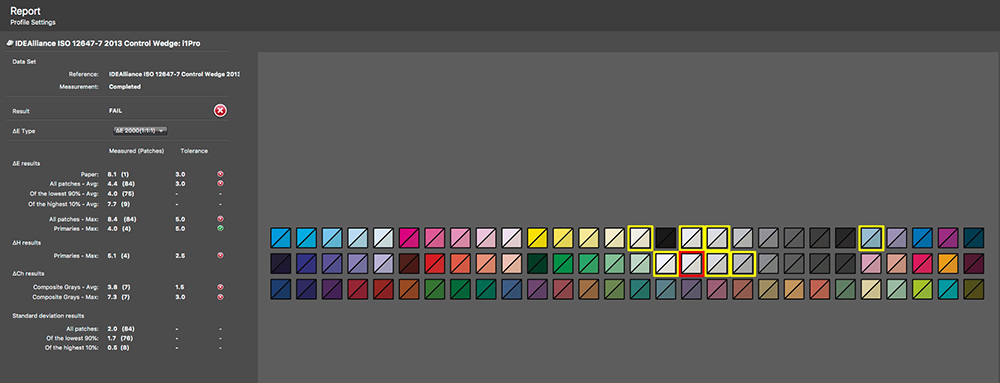
The interface highlights in yellow the most problematic patches. I suspect it failed because regardless of what the patch set looks like, its usage depends on the reference file and there are 7 different reference files all for different CMYK press conditions; in my test I used the GRACOL standard CRPC6, which is not intended for RGB inkjet printers – it expects offset press sheets and inks, which have different chemistry and for the paper, different texture and reflectance; but in our use, that reference file is matched against measurements from an inkjet target print made from an inkjet profile, hence the large dE outcomes. If that’s the explanation, it actually demonstrates that QC is working as it should, because the test should fail if the material being measured is of different technology and chemistry that reacts differently than expected in the test conditions. We want a test to fail if the wrong profile and materials are being used relative to the conditions assumed in the test.
The main purpose of the QC module in MYIROtools, and presumably in i1Profiler as well, is to test for the quality of press proofs; these proofs can be made from, say, Epson or Canon inkjet printers by using a RIP (Raster Image Processor) that has tools for doing the necessary gamut mapping from RGB to the required CMYK press conditions. This could be of interest to the growing number of photographers producing books of their work and want to be assured of the best possible color rendition in the published version, given that the gamut of the latter will be necessarily smaller than achievable with good luster papers in Epson or Canon professional inkjet printers. The details of how to do this proofing with a RIP is beyond my scope here.
We’ll now turn to the same process in MYIROtools, where the design and implementation are different, but essentially the same process and outcome. I’ll use the same test parameters that I used in i1Profiler above.
The QC Workflow with the current version of the software gets dead-ended before a QC report can be generated, therefore it is necessary to operate this procedure with two other modules in MYIROtools instead of the QC Workflow module.
1. Turn on the spectro, open the application, and click on Measure (Figure 16 upper-left icon).
2. Connect and Calibrate (as in Figure 19).
3. In the left side panel, click on QC and select IDEAlliance 2013, and strip-read the target (Figure 59).
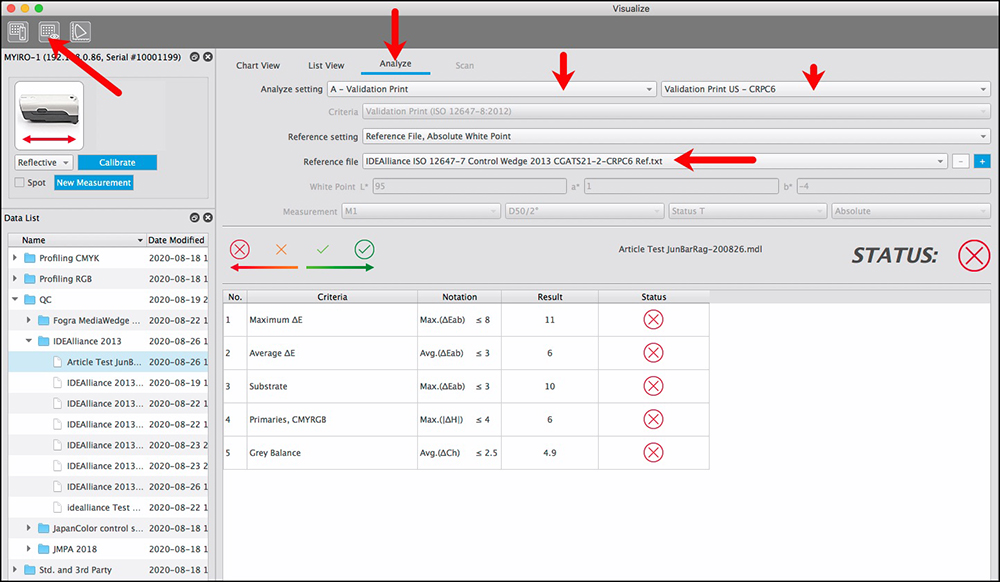
4. Then click on the center top-left icon (for Visualize), click on Analyze, In the Analyze setting select Validation Print US-CRPC6 (for our example – there are other possible settings) and for Reference file check that IDEAlliance CRPC6 is selected. A report is immediately produced showing whether the test passed or failed (Figure 60). As for i1Profiler, the test failed, and most likely for the same reasons explained above.
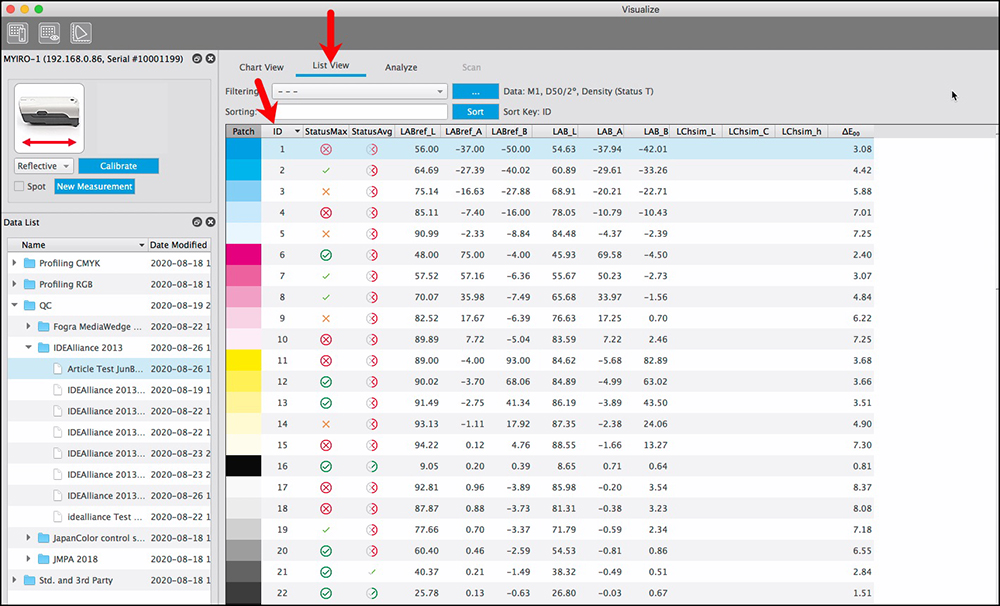
5. By switching to List View, the status of each patch in the test target can be viewed (Figure 61). Much data is available for this view. It is possible to customize the amount of data sets one wants in this view by right-clicking on the little term “ID” just to the right of the Patch column, and check or uncheck items as desired. It works only one item at a time, so you need to right-click the ID header for every single choice. (This is real clunky design – the menu should remain open until one is finished the whole set of selections, but it gets the job done.)
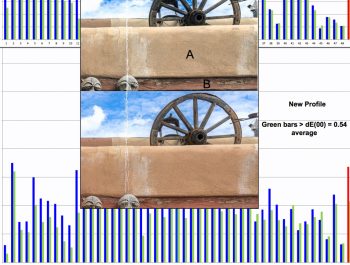
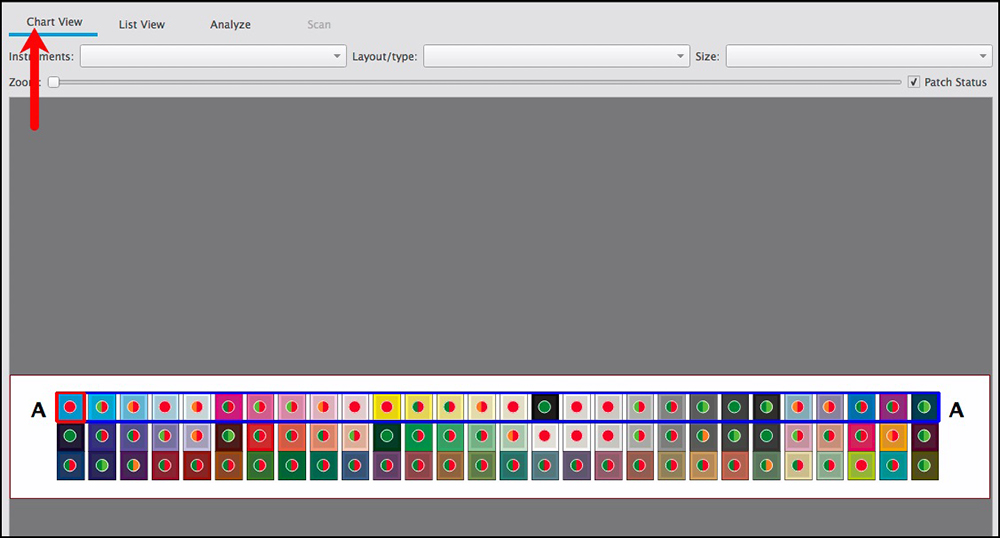
6. By going into Chart View (Figure 62), the results for each patch are shown in the patch layout for a quick overview of where the results are bad (red), quite bad (mix red/green), or OK (green).
So, different look and procedure, but same job and same general outcome as in i1Profiler.
Results
I turn now to the question you’ve probably been waiting impatiently to have answered from the beginning – which system delivers “better” results – MYIRO-1 or i1Pro3 and their corresponding applications? By “better” results I mean more accurate outcomes in terms of color and tonal rendition on paper. For assessing this I use the methodology and materials explained in my article “Augmented Inkjet Printer, Paper and Profile Evaluation (190617)”, https://photopxl.com/augmented-inkjet-printer-paper-and-profile-evaluation-190617/, as well as, for grayscale, my previous article on Luminous-Landscape “Stress Testing the Printer Workflow…”, starting from below Figure 13: https://luminous-landscape.com/stress-testing-the-printer-workflow-extended-printing-accuracy-assessment/. I recommend that readers refresh their understanding of these two articles before proceeding to the material below.
The testing I did is directed at answering two questions: (1) are there systematic differences of print accuracy outcomes between i1Pro3 and MYIRO-1 (and their associated software, and (2) for MYIROtools, what differences of accuracy occur between profiles made of 420, 840 and 2520 patches, as these are the three configurations offered in that software.
I used three papers for these tests because I wanted to look for performance differences between matte paper (Canon Fine Art Smooth – CFAS), a fine luster paper with low OBA content (Ilford Gold Fibre Silk – IGFS), and a slightly more textured luster paper with no OBA content (MOAB Juniper Baryta Rag – MJBR). I did not conduct all the tests on all three papers, rather I was a bit selective to keep the exercise within reasonable bounds, while assuring I obtained enough for a reliable overall understanding of relative qualities.
Voglesong Target
I also conducted one test independent of printer and papers: a reading of the six-patch Voglesong test target, marketed by Chromix. This target’s reference values are custom-measured for each target, so as long as the reference values are accurate the test should be a reliable indicator of instrument accuracy, albeit limited to six patches. The one caution with this approach is that if the instrument used for measuring the reference values has a different implementation of even titularly the same illuminant geometry as that of the instrument used to conduct the test, there could be extraneous instrument-related variances that interfere with a true appreciation of instrument accuracy. So for example, if the reference values were determined using an X-Rite Exact which uses a circumferential structure of the illuminant and we are reading the target with a MYIRO-1 (or i1Pro3) that uses angular structure, this alone could drive differences of results that don’t reflect on the native accuracy of either instrument. I’m not sure whether or how much of a factor this is in the results for the Voglesong test reported here (Figure 63), but given how these results look, perhaps not much.
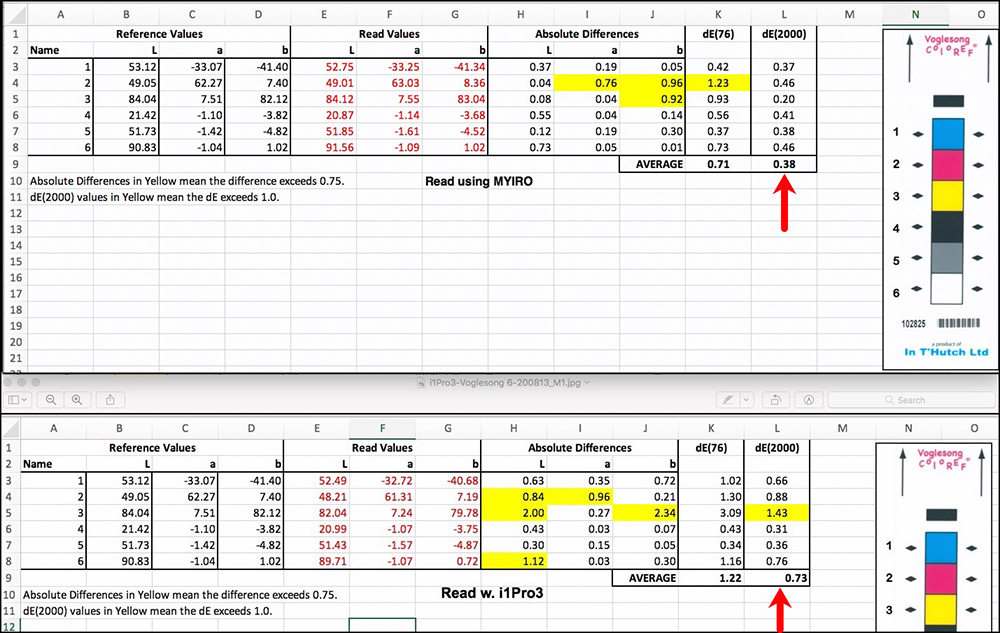
Notice that the average dE(2000) of the six patches is 0.38 for the MYIRO-1 versus 0.73 for i1Pro3. So, the MYIRO is overall more accurate, but both results are very good. The MYIRO result for Yellow is particularly better than that achieved with the i1Pro3.
Results with Epson SC-P5000 Printer and Papers
The remainder of the results all relate to the three papers and the Epson SC-P5000 printer.
For all the following work, each profiling system is a round-trip within itself. This means that I do not use an i1Pro3 to read results of profiles made with MYIRO and vice-versa. There is consistency of hardware and software for both making the profiles and evaluating them.
Most of the profiling and measurement is done in M0 Measurement Condition. I could as well have used M1, but I observed from the data of numerous sample patches that the differences between the two for my print conditions are generally trivial.
All profiling and measurement is based on 2-degree observation and 45° geometry. Both the MYIRO and the i1Pro3 use angular implementation of the illuminant geometry. In i1Profiler, I used Standard Illuminant, D50 lighting, default settings for Contrast, Saturation, and Neutral Gray, the “Large” option for A to B and B to A tables, 16-bit granularity, “Standard” smoothness, Bradford Chromatic Adaptation, V4 profile version, and Default Profile White Point. These options are not yet provided in MYIROtools, but as we’ll see, it doesn’t seem to matter, at least for the testing I can do. MYIROtools does provide an option for Standard or Vivid profiles, and I used Standard.
As an aide-memoire I reproduce here my 48-patch overall evaluation target:

Patch-Set Size
I shall first discuss a question that arises often in discussions of profiling – what difference does the number of patches in a target make to profile quality and results? As mentioned above, MYIROtools offers three fixed options, while i1Profiler allows a more flexible specification and configuration of the target patch count up to 6000 patches. So, I wanted to see whether I’m best-off using 420, 840 or 2520 patch configurations in the MYIRO environment. The amount of time and materials for making a profile changes considerably between each case.
I used MJBR for assessing quality difference between 420 versus 840 patches (Figure 64). Recall that MYIROtools considers the 840-patch target to be the default, or standard.

While the 840 result is a little better in some respects, for the most part the differences are small to the point of insignificance. The 840 profile gamut volume is a tad wider, but no-one would notice this difference in a print. The White and Black points read on paper are almost the same. The difference of average accuracy between them is insignificant. The performance of the worst colour result is only 0.4dE higher for the 420 versus the 840 profiles. Grayscale performance is tight for both – fine hue neutrality and fine linearity. There’s really very little to differentiate here.
Once I saw how well the 420-patch version performed in MYIROtools, I thought I should also test the i1Pro3/i1Profiler version of such a target, so I configured one in i1Profiler, made the profile for the same paper and ran my basic 48 patch test target. At the same time, I repeated the procedure with the MYIRO/MYIROtools. The comparison is shown in Figure 65.
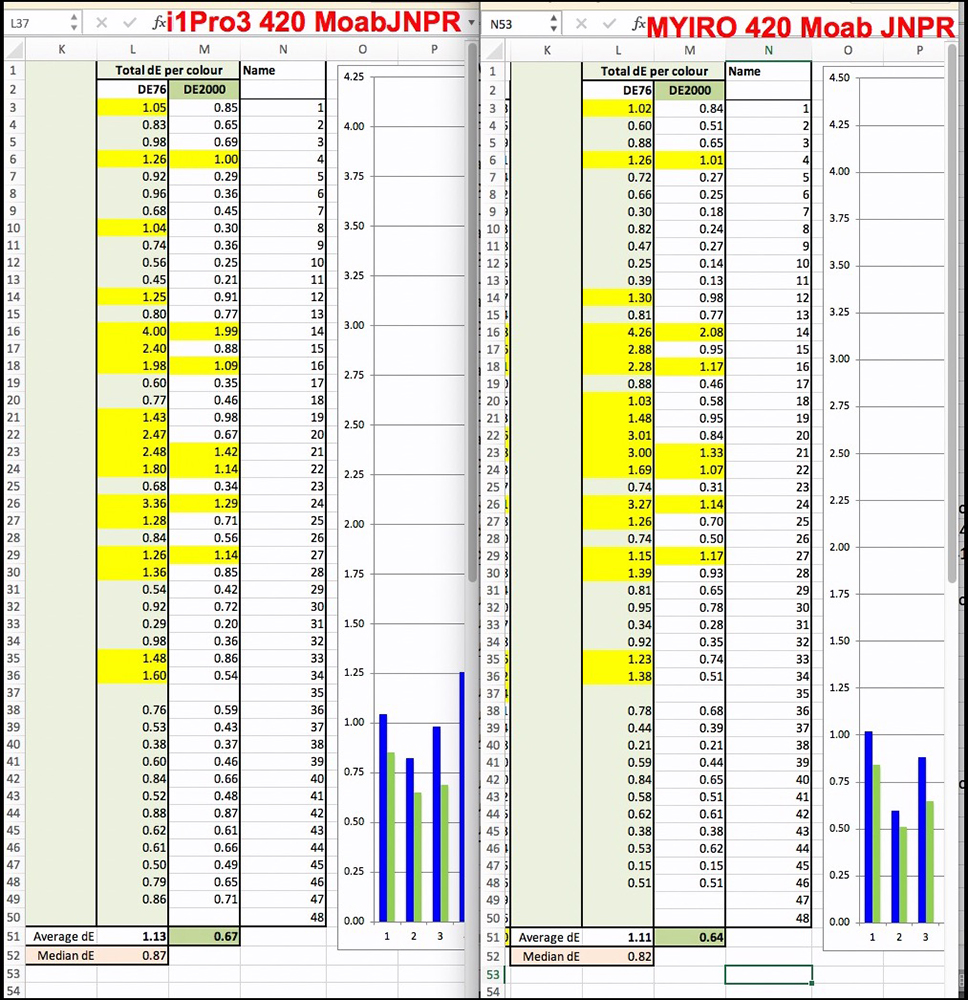
Here we see that in terms of dE2000 on average the MYIRO is very slightly more accurate than the i1Pro3 at 0.64 vs. 0.67 respectively. The worst value for the MYIRO is 2.08 versus 1.99 for the i1Pro3. For both systems, the advantage of a larger patch count is that both profiles would come out with fewer patches having dE2000 greater than 1.0. But the extent to which those patches exceed 1.0 in Figure 65 is not particularly worrisome. These small inaccuracies in a print with millions of colors would most usually not be disturbing, if even noticeable.
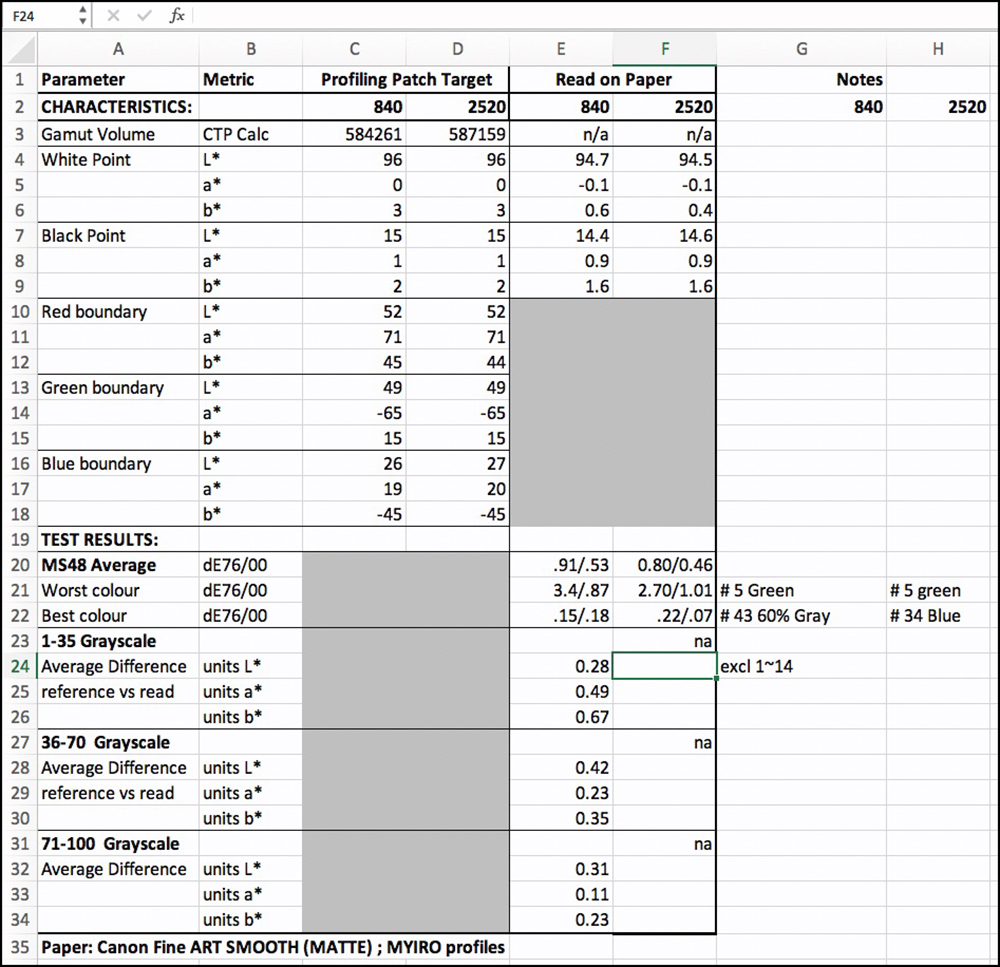
I compared the 840 profile against the 2520 profile for the MYIRO using both CFAS and IGFS papers (Figure 66 for CFAS). For CFAS differences of Gamut volume, White Point, Black Point, average dE2000, and Worst color are trivial.
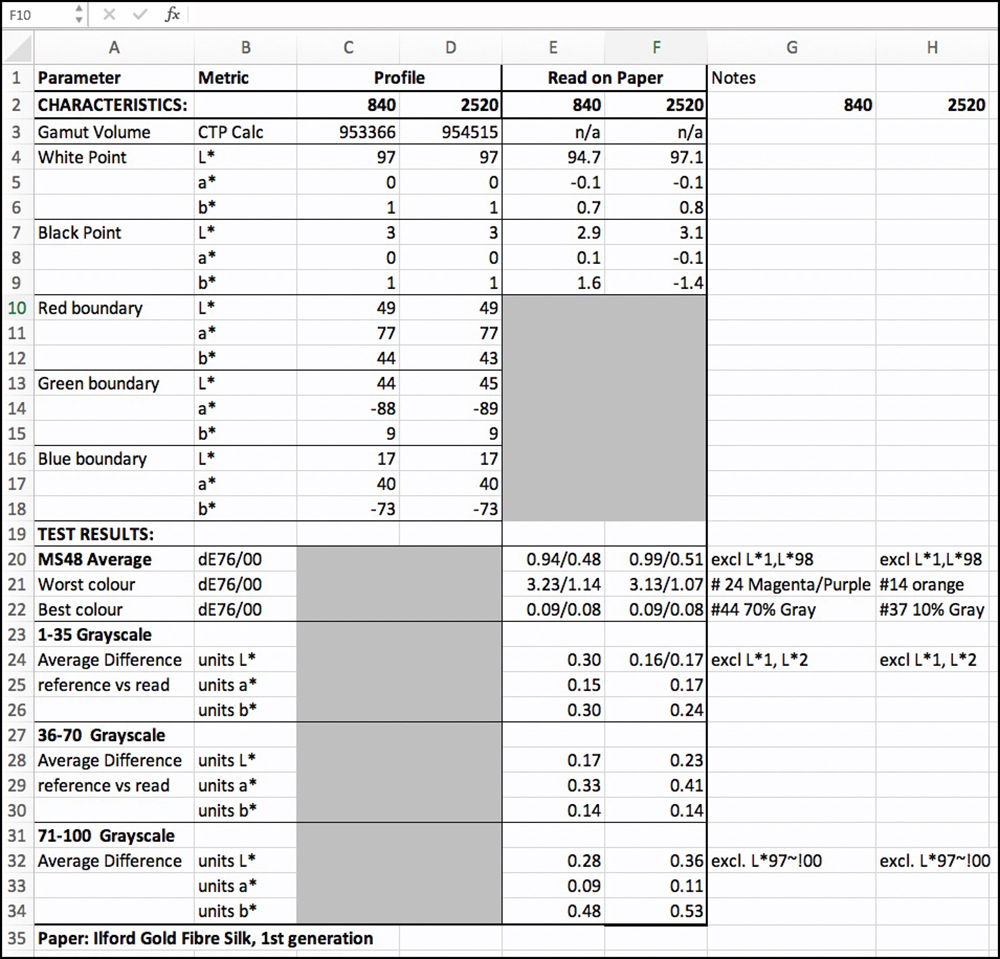
For IGFS (Figure 67), Gamut volumes are very close. The White Point for the 2520 profile is a bit over 2 L* levels above the 840. Black Points are very close. The hues of the White and Black points are very close between the 840 and 2520. The average dE(2000) values are very close and well below 1.0 – in fact quite stellar. The dE(2000) of the worst colors are very close. Grayscale linearity and hue neutrality are excellent for both profiles. My take-away from this is that making profiles with 2520 patches in the MYIRO system seems pointless – and they require three times the amount of paper and scanning time. I’d stick with 840.
Profile Quality – MYIRO and i1Pro3 Compared
For the testing work I did with the i1Pro 3, except for the one test of Figure 65, I used my conventional 2371 patch X-Rite target. Based on the outcomes of Figures 66 and 67, for the MYIRO tests I standardized on their 840-patch target, so the comparison is between the MYIROtools 840-patch default target and the i1 Profiler/i1Pro3 2371-patch target. I built profiles with both systems for CFAS and IGFS.
I’ll focus on the dE(2000) results because Konica-Minolta advised me that their profiling calculations are designed to optimize around dE(2000). It is also the current standard for dE calculations most adequately focused on how people perceive color differences.
For these tests, I took a very granular look at their renditions of the grayscale, because of its importance to high-quality Black & White photography and also to smooth tonal gradations of colors, such as skies (inkjet printers use a lot of grey inks in the color mixtures). For reminders in case you haven’t reviewed my previous articles on this subject, I show just below my three grayscale targets for evaluating the accuracy of grayscale rendition, adding up to 100 patches covering the whole scale except for L*0, which no print condition can achieve.
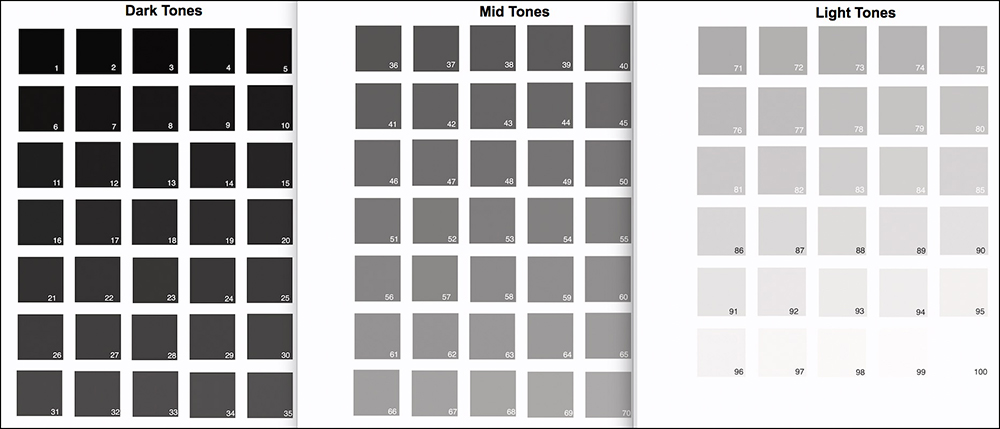
In the three grayscale results graphs related to these targets, one each for Dark tones, Mid tones and Light tones (Figures 69~71 and 73~75), in the large graph, for L* only, the Red line shows the values read from the target print and the black line shows the L* reference values. The smaller graphs underneath show departures from strict hue neutrality. The Red bars are for the a* channel (green/cyan to red/magenta) and the Blue bars are for the b* channel (blue to yellow). The closer they are to zero (the horizontal axis) the more neutral the hue of “gray”. The bars would be invisible with a perfect gray.
Canon Fine Art Smooth
For CFAS (Figure 68), I eliminated patches 35, 36, 37 and 48 from the dE calculations because they are out of gamut (OOG). Anything OOG relative to reference values will produce meaningless dE values that mess-up the evaluation, as there’s no point testing a printing condition for what it cannot do.
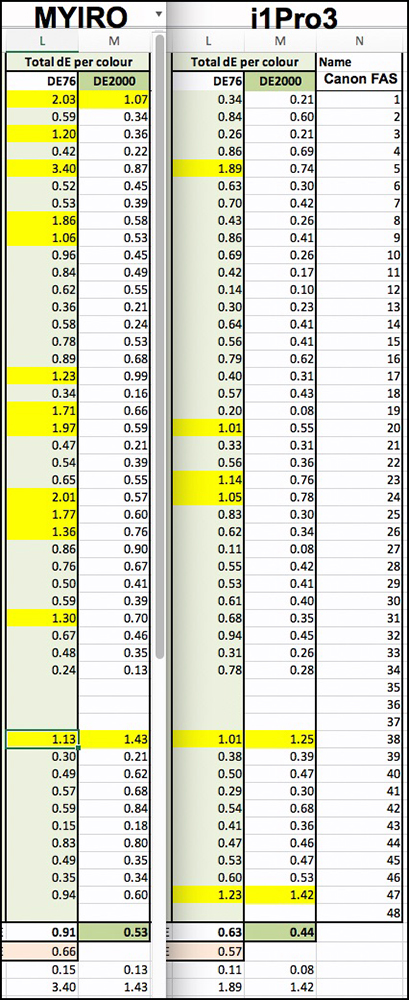
For CFAS, the i1Pro3 produced a slightly lower Average dE(2000) result 0.44, versus 0.53 for the MYIRO; but the difference is insignificant. If you look down the list of patches for both devices in Figure 68, you will observe that in each case there are only two values that exceed dE(2000) = 1.0, and the extent to which they exceed 1.0 is unimportant. These results are fine for both instruments.
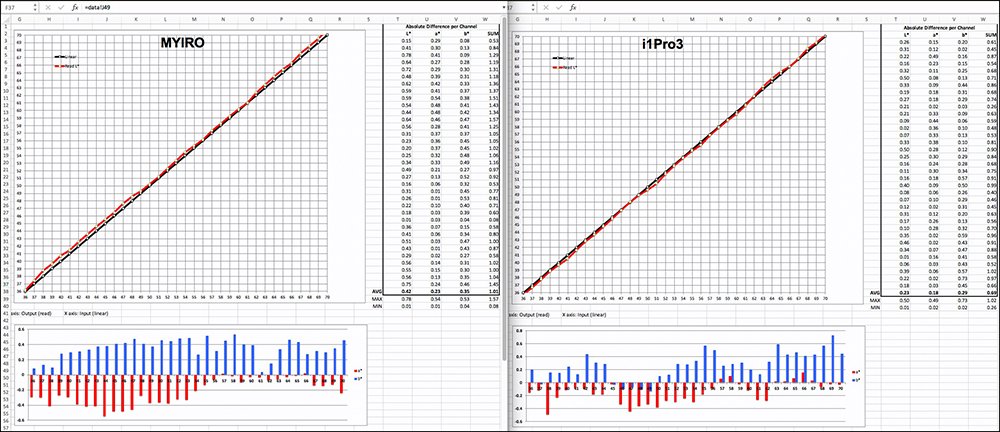
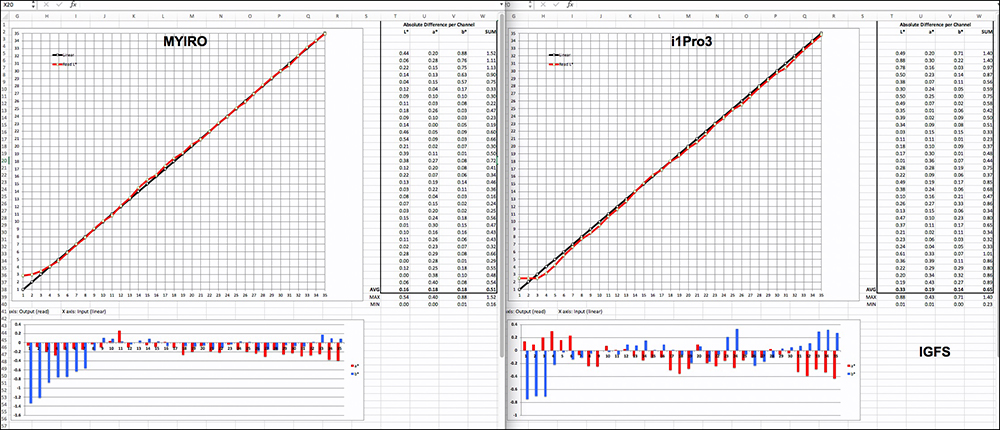
For the dark tones (L*1 to L*35 – Figure 69), recall that matte papers seldom achieve denser Black than about L*14~L*15, so with targets printed in Absolute Rendering Intent where there is no Black Point Compensation and no Relative tonal adjustments, all the levels of Black that the printing condition cannot reproduce are stuck at the floor of the densest Black the paper/printer can achieve. That is why you see straight red lines at about L*15 until the progression begins upward of L*15.

From L*15 upward, for both instruments, the linearity relative to the reference values is very good, save for a slight departure between levels 16 and 20 for the MYIRO. The blue and red bars at the bottom of the tone graphs show that beyond L*15 hue neutrality is satisfactory with both instruments. The data for these graphs is to the right of each graph, where “Absolute Difference” is the arithmetic absolute difference between the printed values and the reference values (please see my previously referenced articles for a detailed explanation).
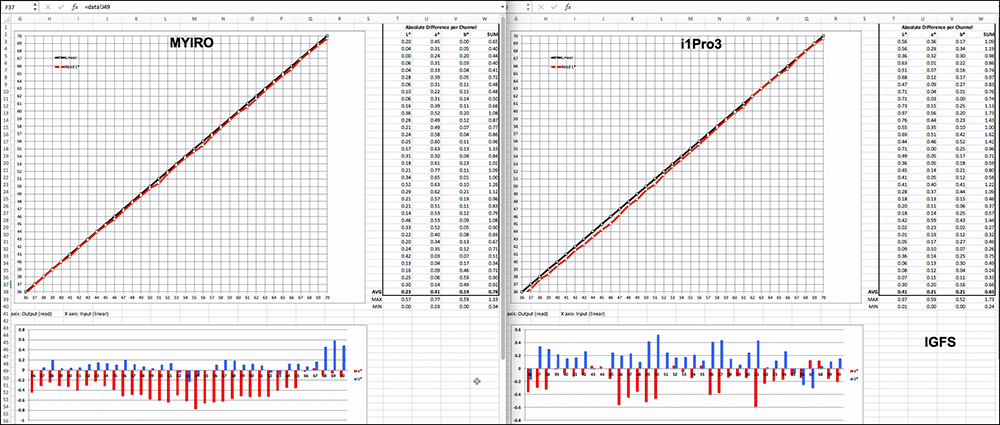
Turning to the grayscale mid-tones (L*36~L*70 – Figure 70), the comparison between the instruments is similar. The results from both systems are essentially excellent, the i1Pro3 exceeding the MYIRO by margins that would be undetectable to the human eye. While the hue neutrality bars look a bit menacing in terms of their irregular departures from zero, it’s important to look at the left side axes of both graphs and realize that these values are wiggling around within differences that are below the threshold of human visual perception to distinguish.
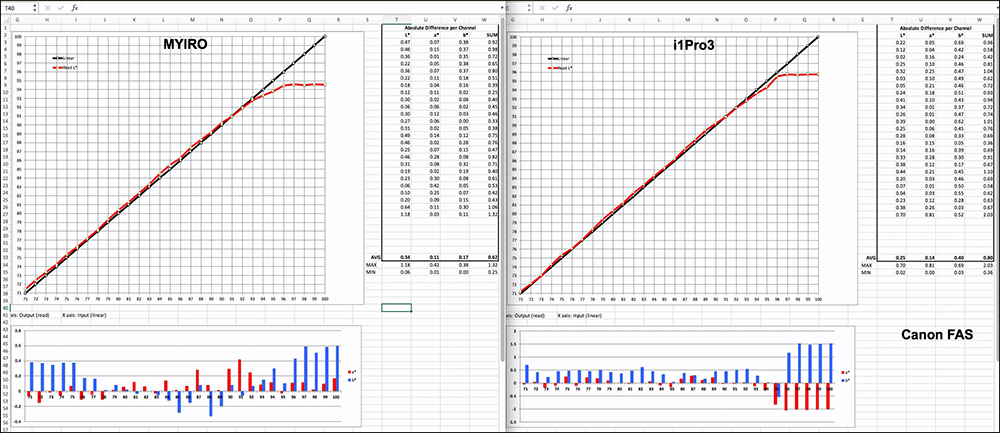
For the light tones (L*71~L*100 – Figure 71), the only perhaps remarkable difference between the MYIRO and the i1Pro3 is that the former tops out at about L*94.6 and the latter at about L*95.8 (a difference of 1.2 L* values). Performance on both tonal linearity and hue neutrality is generally fine for both. The small differences between them are not significant.
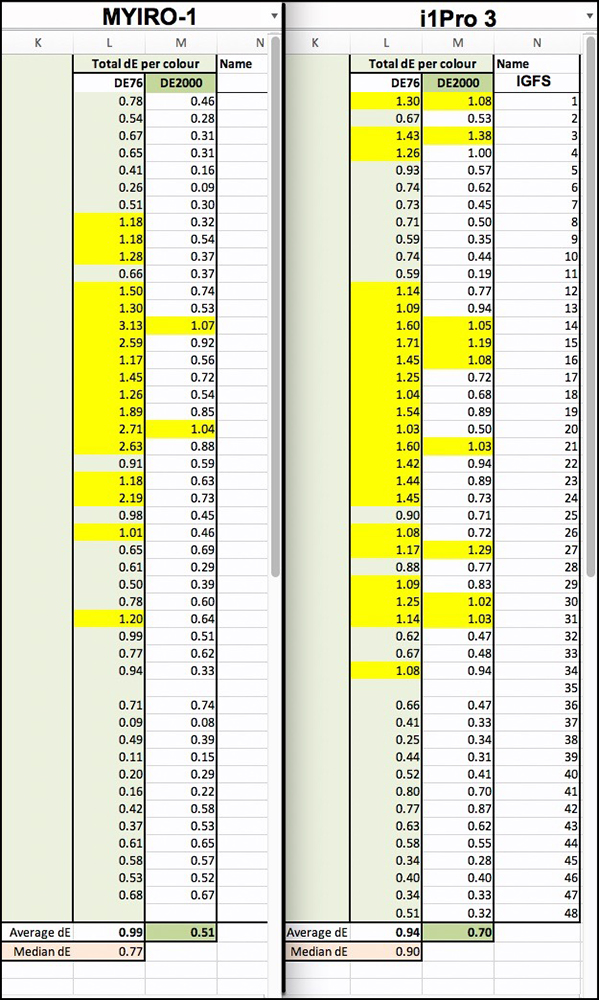
Ilford Gold Fibre Silk
For IGFS, the MYIRO slightly out-performed the i1Pro3 in respect of dE(2000) – 0.51 for MYIRO, versus 0.70 for i1Pro3 (Figure 72). The MYIRO shows only two patches with dE(2000) slightly greater than 1.0, while for the i1Pro3 there were nine, the two worst being 1.38 and 1.29.
The Neutral Dark Tone scale performs very well with both systems (Figure 73), the MYIRO a tad better than i1Pro3.
While the i1Pro3 records a very slightly denser Black than the MYIRO, both show remarkable linearity of the L* scale, again, the absolute average deviation from reference values being 0.16 for MYIRO and 0.33 for i1Pro3. Hue neutrality is also well reflected in both, the differences between them on the whole being unremarkable. For both, the blackest tones tend to show less neutrality than the remainder of the scale, but the first few levels from Black are very dark and they measure as only very slightly bluish, therefore most likely to be unremarkable.
The mid-tones also perform very well in both profiling systems (Figure 74). The MYIRO system scores slightly better than the i1 system for L*, while both of them manage to retain hue neutrality with variances well below 1 a* or b* level in both cases.
The Light tones also perform very well in both systems (Figure 75). For the White Point, MYIRO tops-out at about 1 level below i1Pro3. Linearity of the tone scale is slightly better with the i1Pro3 but fully satisfactory for both of them – differences are minor. As well, the i1Pro3 is very slightly more hue neutral than the MYIRO, but here too, the differences are unremarkable.

Summing up, users would not be disappointed with either of these profiling systems. They both deliver results that appear to be very close to each other in terms of producing accurate results on paper, to the extent this data can reveal. I have also spot-checked outcomes by selectively printing the Atkinson Printer Test Page or BVDM Romans-16 reference images, and honestly, one doesn’t want to spend too much time and materials doing this, because I’ve found that the numbers are a good predictor of how these sheets will look. I should also mention of course that the very high quality of the Epson SC-P5000 printer and the papers I am using are major contributors to this success.
The Shopping Cart
Well, now that we’ve turned these products inside-out and upside-down, the inevitable question arises about where to buy them and what they cost. And why buy either of them.
I’ll start with the second question – why buy either of them. The fact is that manufacturers and suppliers have, over time, vastly improved the quality of the profiling they offer with their products, their profiles are free and more often than not they perform quite well. As well, there are people in the business of providing custom profiles usually priced in the range of 75-100 dollars each. So, a case can be made that there’s no point spending all this time and money making one’s own profiles. Many people may well find it more sensible for them to either use an OEM profile or occasionally order profiles from a service provider.
That said, there are good reasons for buying one’s own profiling system. Firstly, those who wish to use quite a variety of media, some of which may have good OEM profiles, others not, would appreciate the flexibility of having a personal solution ready at hand right in the studio. Secondly, a profile is not suitable for all time. Equipment and materials can drift over time making reprofiling worthwhile. Thirdly, papers and printers are an evolving species with new types and new models hitting the market quite regularly, and for each one you want to try, new profiles will be needed. Fourthly, if you want to wring the last bit of quality or different effects out of your printing system, custom profiling your specific equipment, or experimenting with different profile settings in your own studio environment would make sense.
So no, I didn’t tell you that you should go out and spend X000 on a profiling system, but I did provide some factors to consider in a decision about whether or not to do so.
Now let’s revert to the first question about from where and how to buy.
Firstly, at the time of writing, MYIRO-1 and MYIROtools are not yet commercially available in North America. The products will be sold through a North American distributor and those arrangements are under advanced development now. In the meanwhile, those interested may fill and send a form from the MYIRO website (https://www.myiro.com/partner-map), and the company will advise you of distribution when possible, they expect not long from now.
X-Rite and KM have different pricing practices.
KM has priced the MYIRO-1 at USD 1430 for the instrument, 1300 for MYIROtools and 170 for the optional ambient light disc. One can live without the ambient light disc, but the instrument and the software need to be used as a package for profiling or QC, so think of USD 2730 for the basic package which includes both RGB (inkjet) and CMYK printer/press profiling, excluding a backboard and device holder for monitors (which don’t exist yet) and excluding the optional ambient light disc. There is no stated pricing policy on software upgrades, and this software is at a stage of development indicating there will definitely be new versions to come. KM hasn’t said whether upgrades will be at no charge beyond the first cost of the license. KM imposes restrictions on offering profiles to third parties.
X-Rite targets different niches of the market with different offerings that come at different prices, and the price is for the bundle of instrument and i1Profiler. I1Basic Pro3 costs USD 1449 and allows for display, projector and scanner profiling – no printer profiling. I1Photo Pro3 costs USD 1800 and adds RGB (inkjet) printer profiling. I1Publish Pro3 costs USD 2500 and adds CMYK press and printer profiling. The X-Rite packages include the backboard, ambient light disc and device holder for display profiling. X-Rite has been providing i1Profiler version updates at no charge, so one presumes that this policy will continue through the life of the i1Profiler application as such; this is a quite mature application by now. X-Rite imposes restrictions on offering profiles to third parties.
Given that both i1Publish Pro3 and MYIRO support CMYK printing processes, these would be the packages to compare commercially, and as of now the X-Rite package is some USD 230 less than the MYIRO package. This is not a large price difference for those who want both RGB and CMYK capability; but for all those photographers, studios and service providers who have little interest in the CMYK world, the i1PhotoPro3 bundle would suffice and for that the price difference relative to MYIRO is a more considerable USD 930. I believe this is an issue KM needs to think about.
There is a note at the end of the Annex on monitor profiling that will be of commercial interest to those wishing to use basICColor display6 with a MYIRO-1 instrument.
Finally, for people who own spectrophotometers, there is what I would term a “sleeper issue” about which one sees very little discussion, and that is the question of “recertification”. X-Rite generally recommends that users have their instruments recertified annually. This doesn’t come cheap. X-Rite charges USD 500 for it. KM has yet to issue a policy for recertification because the product is too new, but they will, and I suspect we should count on pricing being in a similar ballpark.
The need for recertification could show-up as inexplicable deviant outcomes for the kind of readings the user is familiar with. Over time, instruments can drift. The recertification procedure consists of sending the instrument back to the manufacturer with a payment arrangement, and the manufacturer sends back to the user another instrument that has been “recertified”. Under the hood, my understanding is that recertification consists of cleaning-up key components, checking accuracy against a standard using BCRA tiles that are as colour-constant as anything can be, making any internal adjustments needed to achieve compliance with the standard, and issuing a certificate with the instrument saying it is compliant. I’ve had recent recertification experience with my previous i1Pro 2. There were issues, but I must say the X-Rite staff were supportive in sorting it out. Based on this, my advice is to not recertify unless you’re really very sure your instrument needs it, and then test carefully when the refurb you get comes back to you.
That’s it folks – happy profiling!
Annex: Display profiling with the MYIRO-1 and basICColor Display 6
by Christopher Campbell
I was extremely impressed with the MYIRO-1 during my several weeks of evaluation testing, and when measuring a number of camera profiling targets I made special note of its accuracy (the degree to which reported results match a known standard), its repeatability (capacity to report the same number when repeatedly measuring the same target), and its inter-instrument agreement (reporting the same numbers as another Konica Minolta instrument on the same target). By contrast to the i1Pro 2, the precision and depth of the black measurements was particularly noticeable, and I understand that this is due in part to the fact that the MYIRO-1 is temperature stabilized.
Similarly, profiling displays with the MYIRO-1 and basICColor display 6 was a pleasure. With the instrument connected via WiFi, there was no longer any need to be threading the USB cable over and under my iMac Pro and NEC PA272W displays, so “cutting the cable” is a real plus for profiling large and/or multiple displays. On the other hand, Konica Minolta doesn’t supply any handy mounting assembly like the X-Rite weighted strap for display calibration, so users needs to supply their own. I opted for a small tripod which would allow the instrument to be positioned on the desk in front of the displays. For emissive measurement, the MYIRO-1 is remarkably flexible in terms of distance, and can be positioned anywhere from 5 – 30 mm from the display surface. Since I don’t have a problem with controlling ambient light in my office, I profiled my displays with the MYIRO-1 positioned a comfortable 1 cm from the display. The MYIRO-1 doesn’t require any additional software for calibrating the instrument prior to display profiling, and the usual method with the calibration cap (conveniently stored in the underside of the MYIRO-1) is fast and easy.
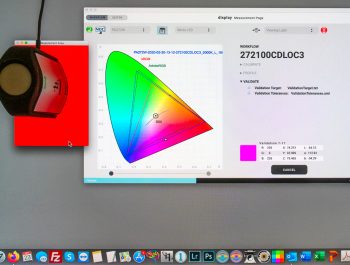
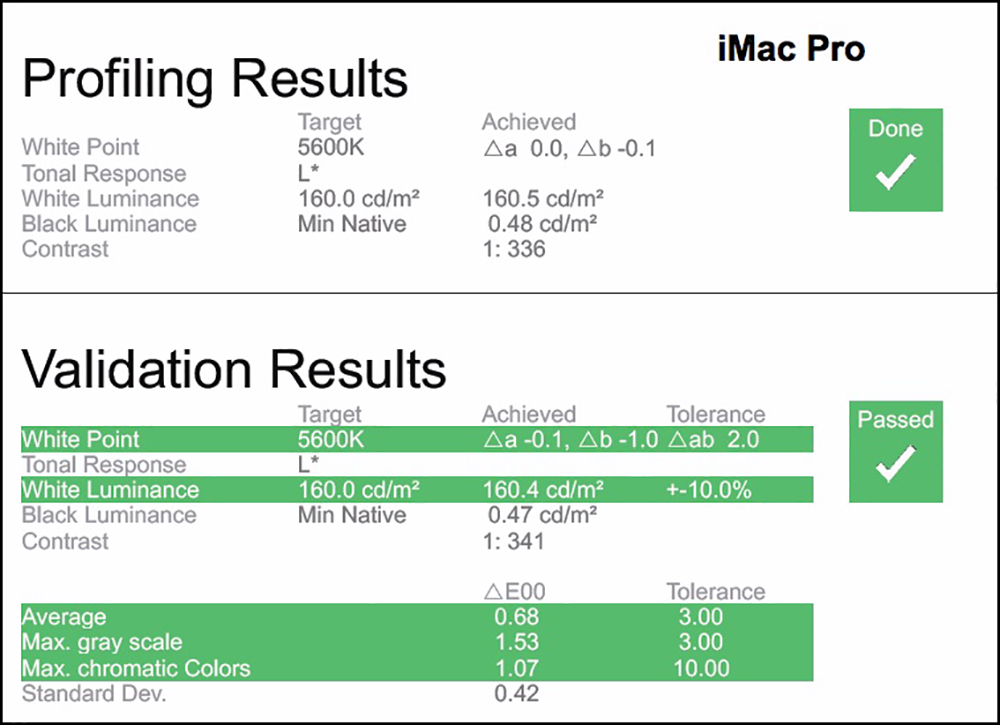
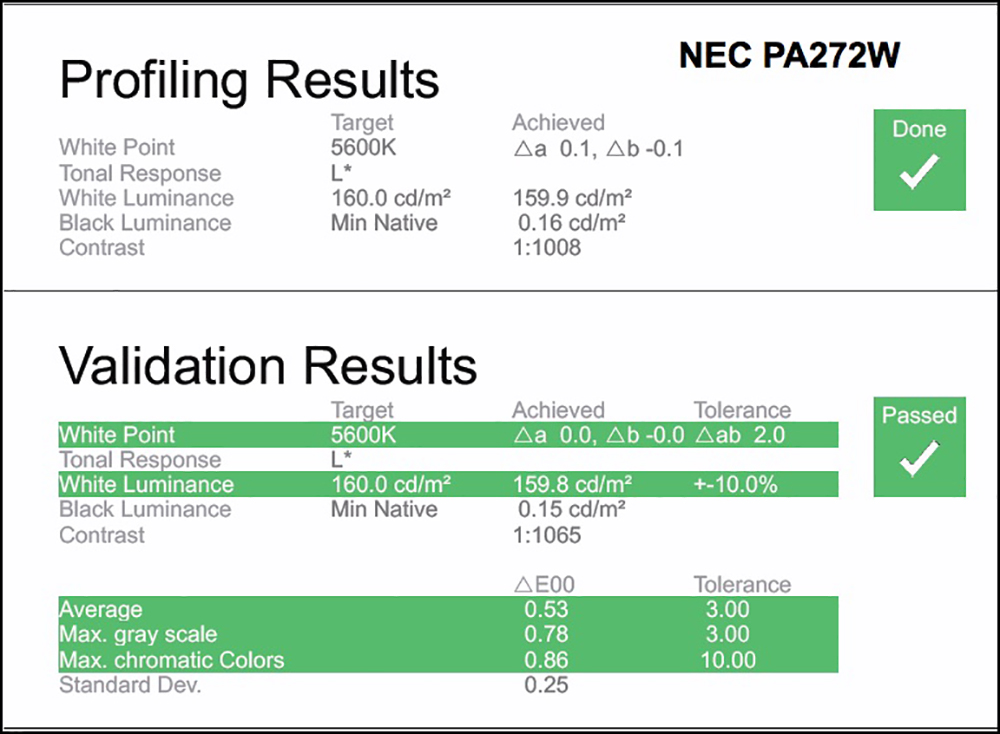
In the past, working with an NEC MDSVSENSOR3 (an OEM version of the X-Rite i1Display Pro), setting the brightness of an iMac display to a precise level was always a bit of a struggle. By contrast, the MYIRO-1 was almost weirdly accurate, and when my target was 160.0 cd/m2, the achieved result was 160.5 cd/m2. Using the direct hardware access to the NEC PA272W, the achieved result was even closer, 159.9 cd/m2! Mark and I have already reviewed basICColor display 6 for both photographic and video use, so I won’t belabor the process here. Suffice it to say that I found the combination of the MYIRO-1 and display 6 to be easy to use, and extraordinarily precise, creating consistently excellent profiles for both my displays, at a variety of brightness levels (120 – 160 cd/m2), and at both D56 (photo editing) and D65 (video editing).
Below are the validation reports from basICColor Display 6 for the profiles from both displays.
Commercial Note from Mark Segal: KM has advised me that a version of basICColor Display 6 will be bundled with Version 1.2 of MYIROtools, expected probably in November 2020. This version of Display 6 will work only with the MYIRO-1 instrument and can be used on any computer having installed the free version of MYIROtools.
Mark Segal
September 2020
Toronto, ON
Mark has been making photographs for the past seven decades and started adopting a digital workflow in 1999 first with scanning film, then going fully digital in 2004. He has worked with a considerable range of software, equipment, materials and techniques over the years, accumulated substantial experience as an author, educator and communicator in several fields, was a frequent contributor to the Luminous-Landscape website and now contributes frequently with in-depth articles on the PhotoPXL website. Mark has contributed over 75 articles to the two websites up to Q1-2024, with a particular emphasis on printers and papers, given his view that a photograph printed on paper remains the epitome of fine photography, as it has been from soon after the medium was invented and started gaining momentum in the 1830s/1840s. Mark developed a particular interest in film scanning and authored the ebook “Scanning Workflows with SilverFast 8, SilverFast HDR, Adobe Photoshop Lightroom and Adobe Photoshop” (please check our Store for availability). In his “other life” (the one that pays for the photography), Mark is a retiree from the World Bank Group and was a consultant in electric power development.