Four New Canson Infinity Arches Papers
Legion Paper contacted me a little while back asking if I would like to test four new papers Canson is bringing to market. It’s always welcome news to see an expanded choice of high quality fine-art papers, so I readily agreed, they sent me some samples, and here we go.
To begin with, the paper-naming gurus have been at it again, and the names given the papers in this review (with my abbreviations for them in brackets) are all Canson Infinity Arches:
- 88 (88)
- Aquarelle Rag (AR)
- BFK Rives Pure White (BFKPW)
- BFK Rives White (BFKW)
All four are mould-made “fine art” matte papers with cotton substrate and no OBAs. For Epson printers the recommended Media Type is Epson Velvet Fine Art Paper and Matte Black ink. “Mould-made” papers simulate hand-made papers in a mechanized process. (One explanation here: http://www.stcuthbertsmill.com/advice-centre/?id=1).
All four are intended to be supplied in a full variety of sheet and roll sizes – details here: https://www.canson-infinity.com/en/product-selector. Several sizes may be not yet available. Please check the linked website for updates. All four are a robust 310 g/m2.
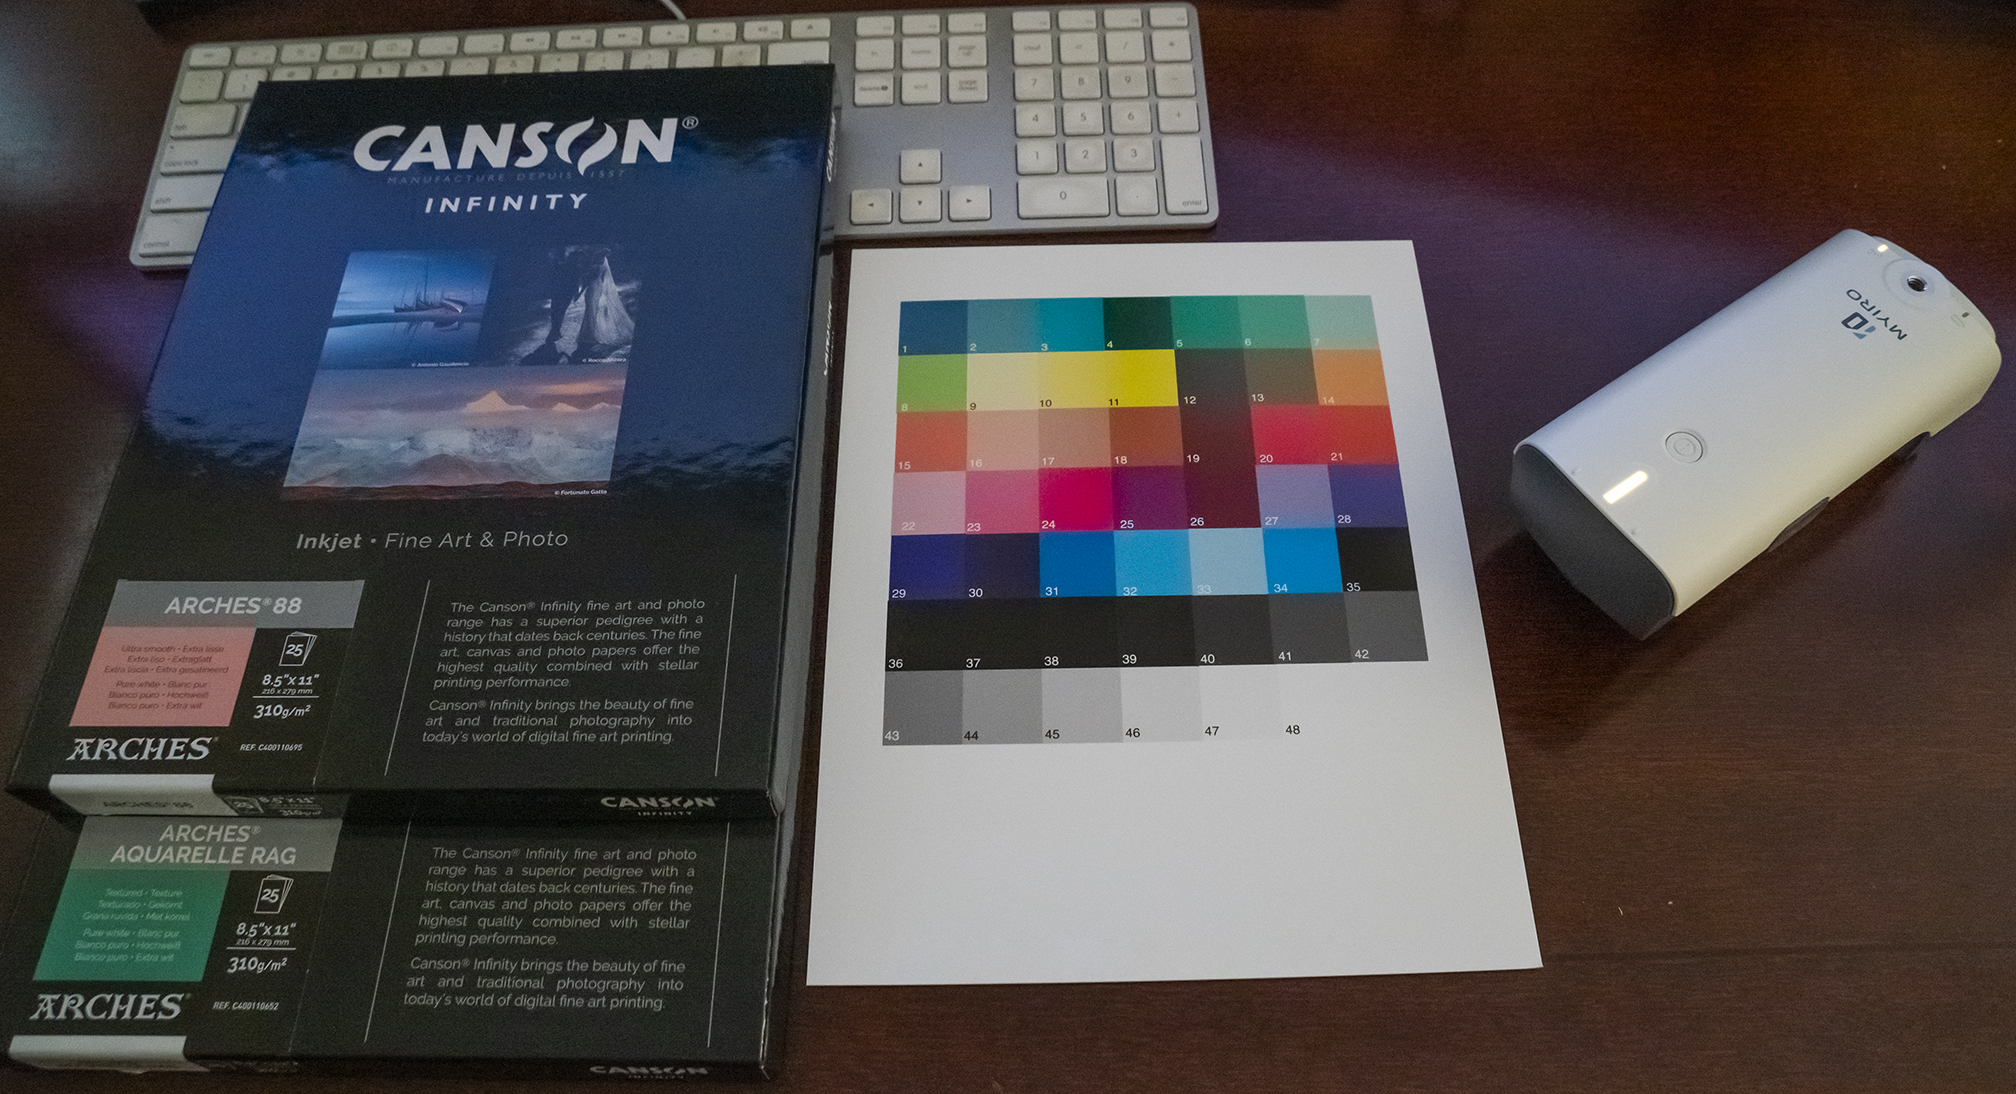
88 is a smooth white paper. The printing surface is easily differentiated from the substrate.
AR is a rather coarsely textured paper, reminding me of Epson Legacy Textured. For this paper you need to keep the paper inside the plastic envelope that shows which is the printable side, otherwise it will be difficult to know how to load it. But in case you mess-up with this, here’s a hint that works for all of these papers: the side that feels peach-like fuzzy is the non-printable side. The side that feels a bit “harder” (because it’s coated) is the printable side.
BFKPW is slightly textured and looks just a tad whiter than BFKW.
BFKW has a texture between those of AR and BFKPW.
While the “gsm/m2” is the same for all four papers, the two BFK papers are stiffer, so to load them I had to press down gently from the top edge at start of loading for the SC-P5000’s top paper feed to grab them. Once grabbed, they worked well in that paper feed.
This review follows my usual procedure of looking at the papers’ characteristics through OEM and custom profiles (both for the Epson SC-P5000 printer) followed by printed test charts and real photographs designed for evaluating their photographic properties.
Paper Characteristics From OEM Profiles
Figures 1 to 4 show the data summaries for each of the papers, for now focusing on Column D, upper portion.
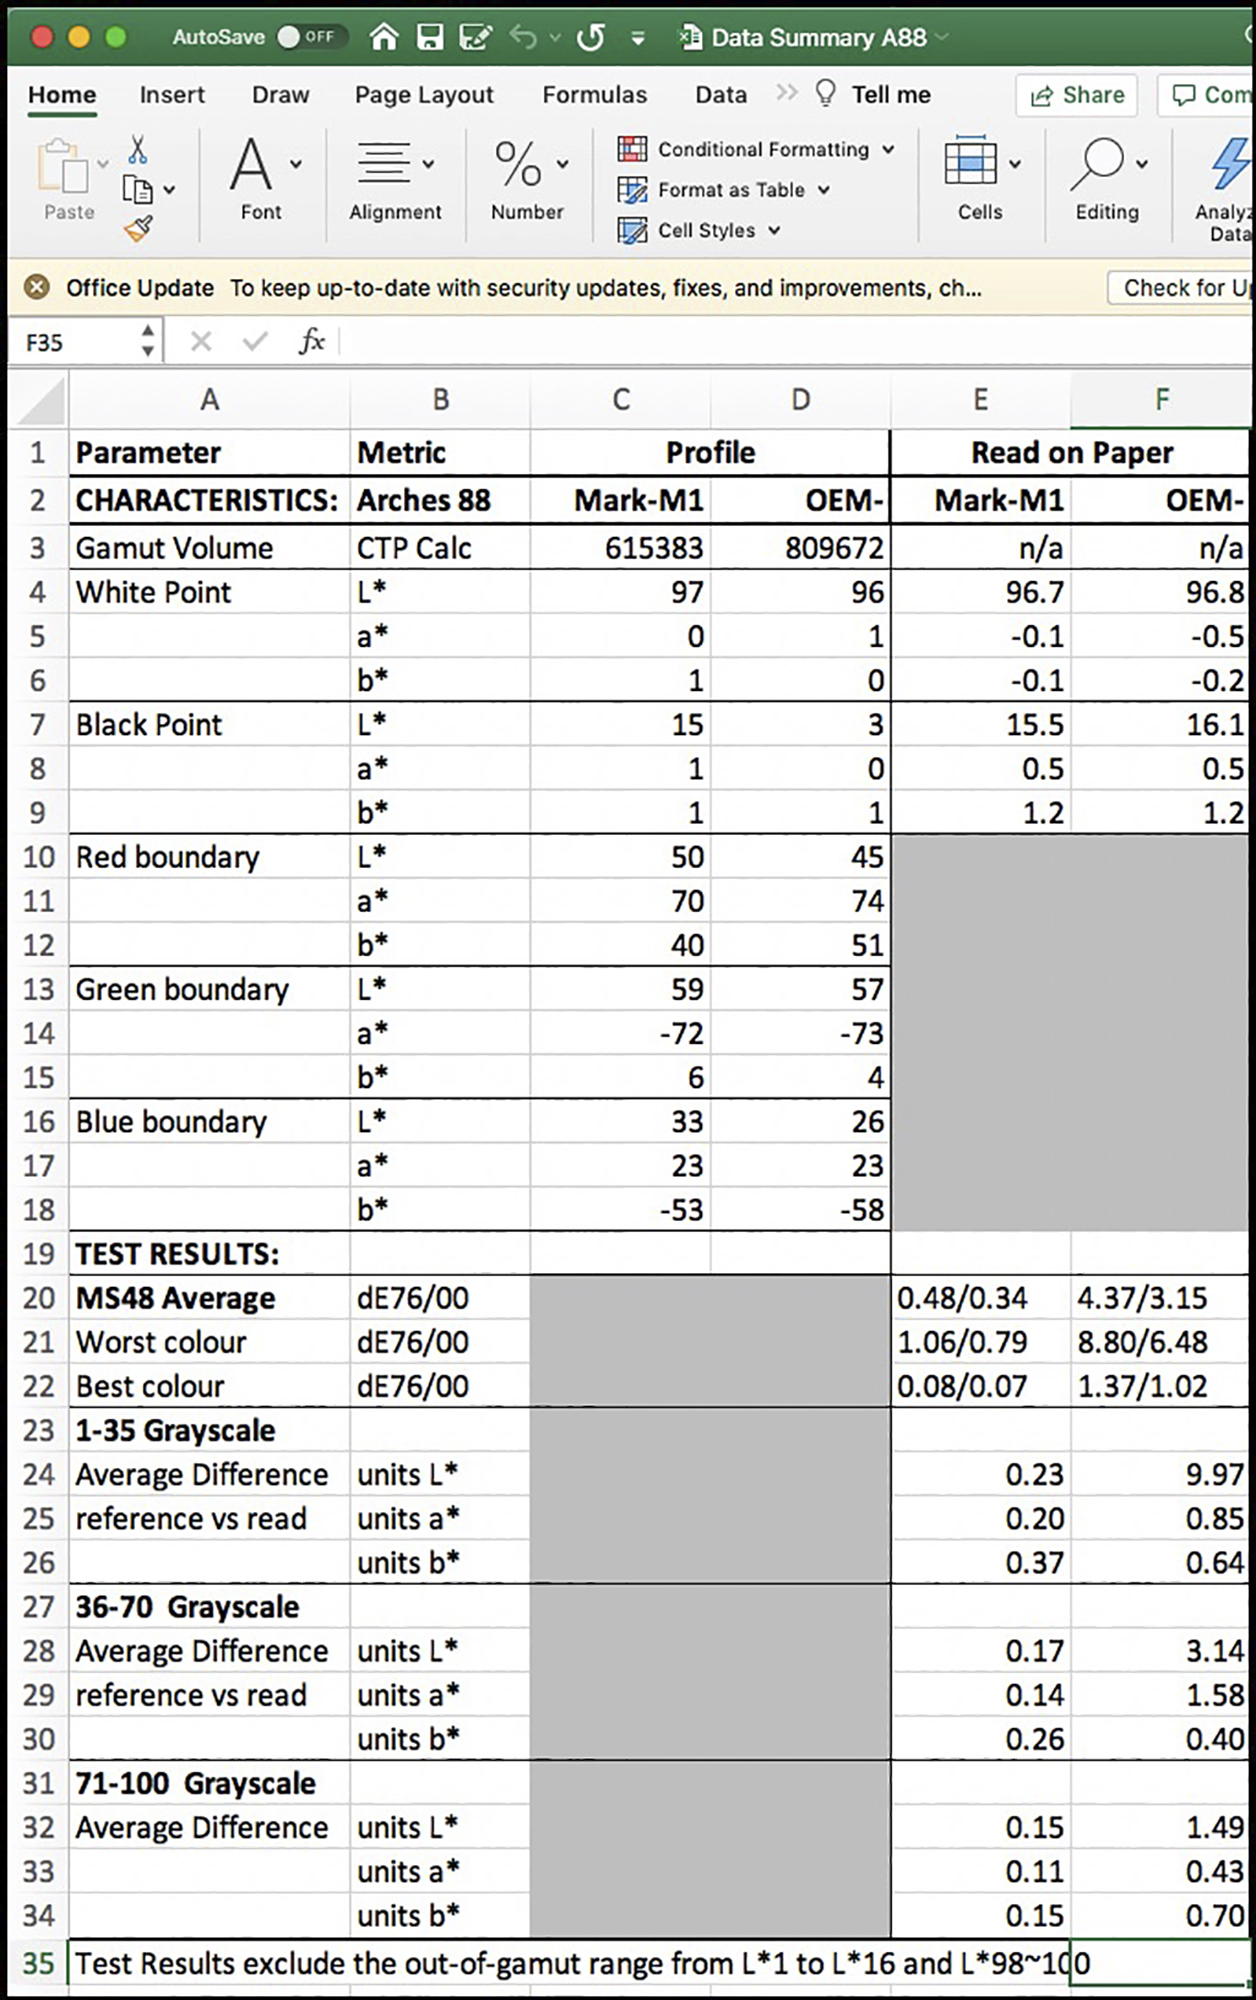
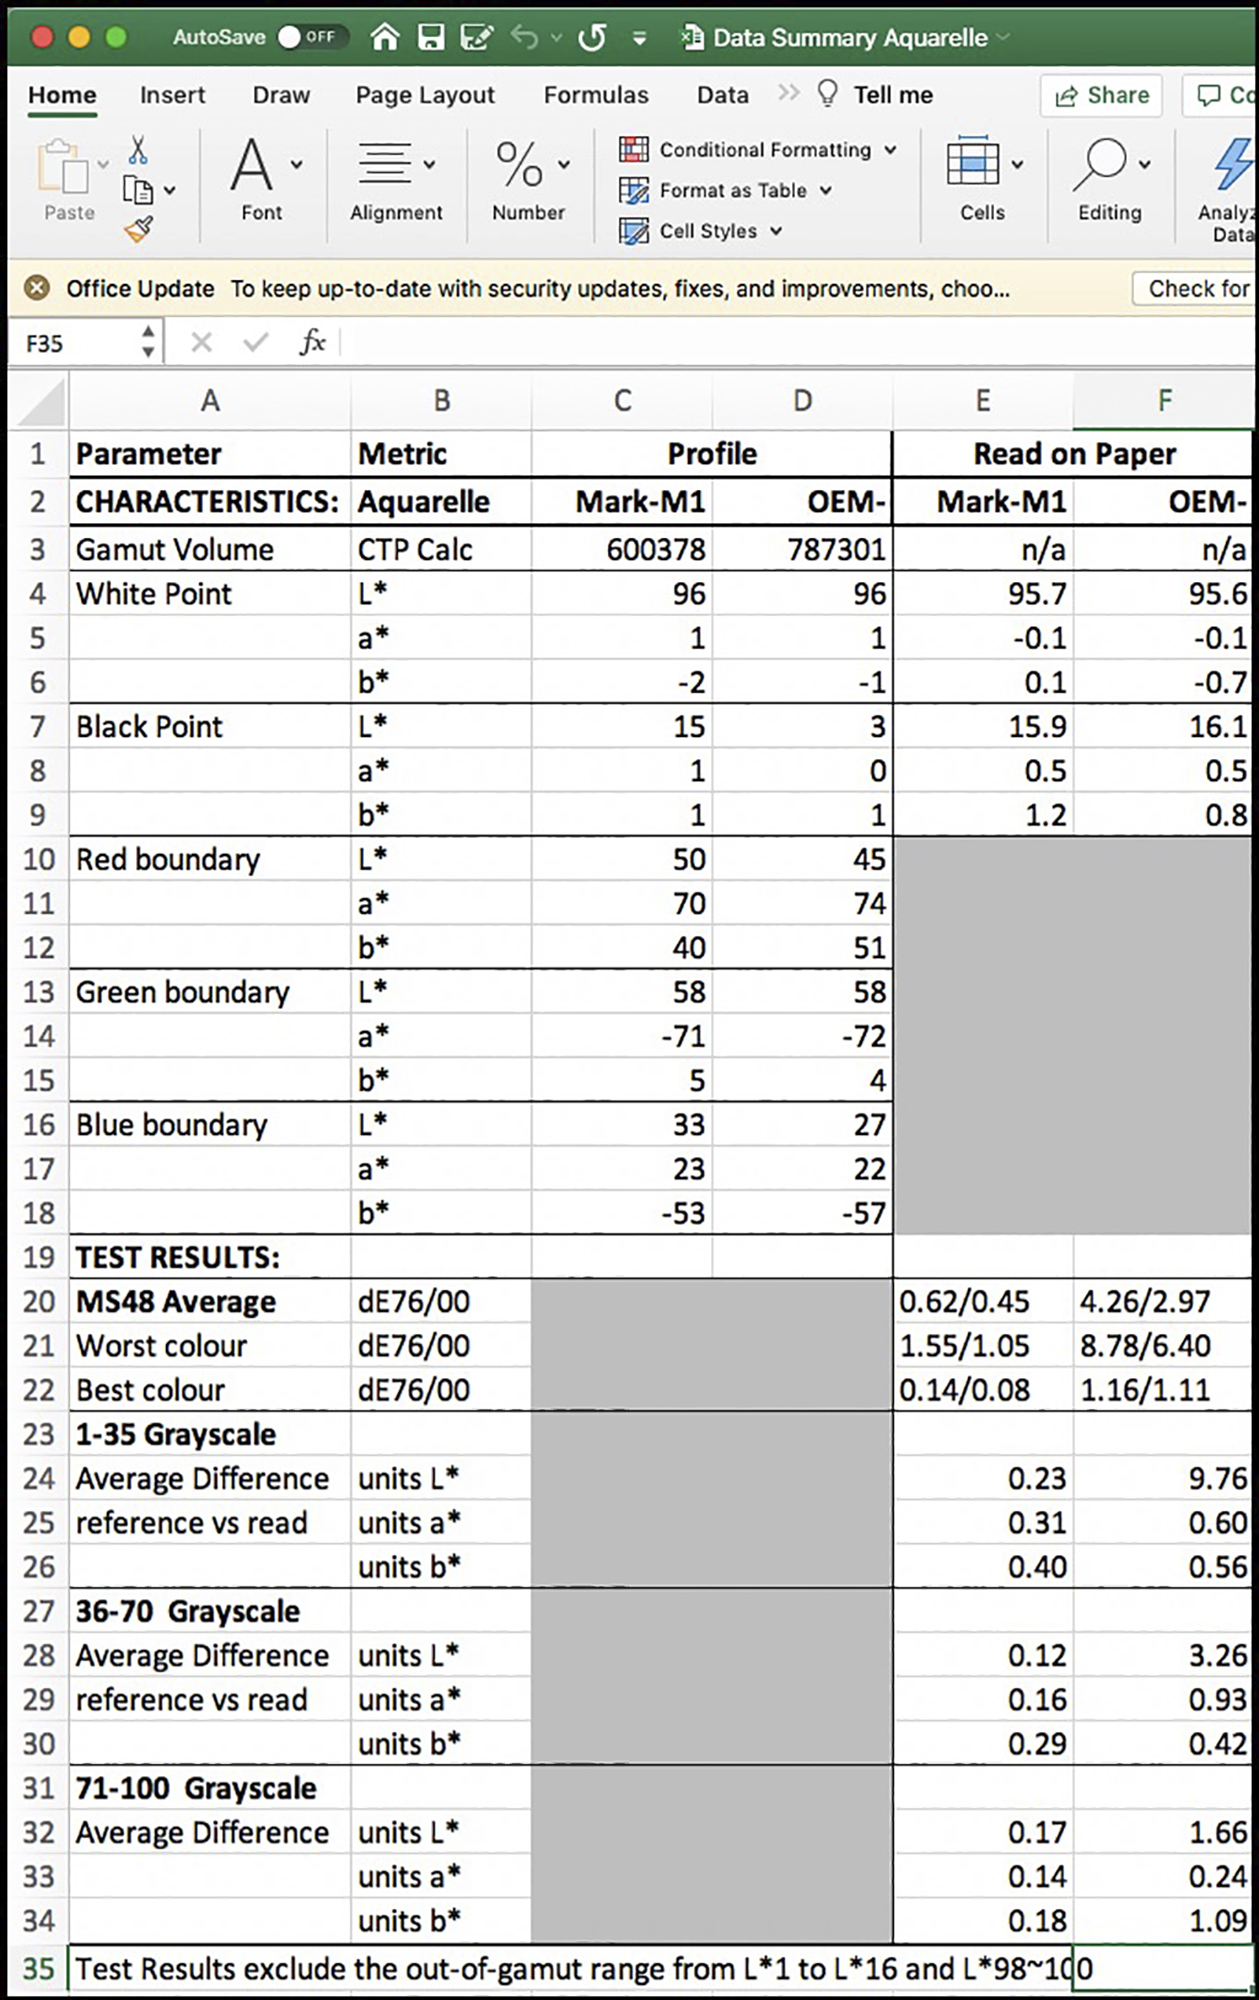
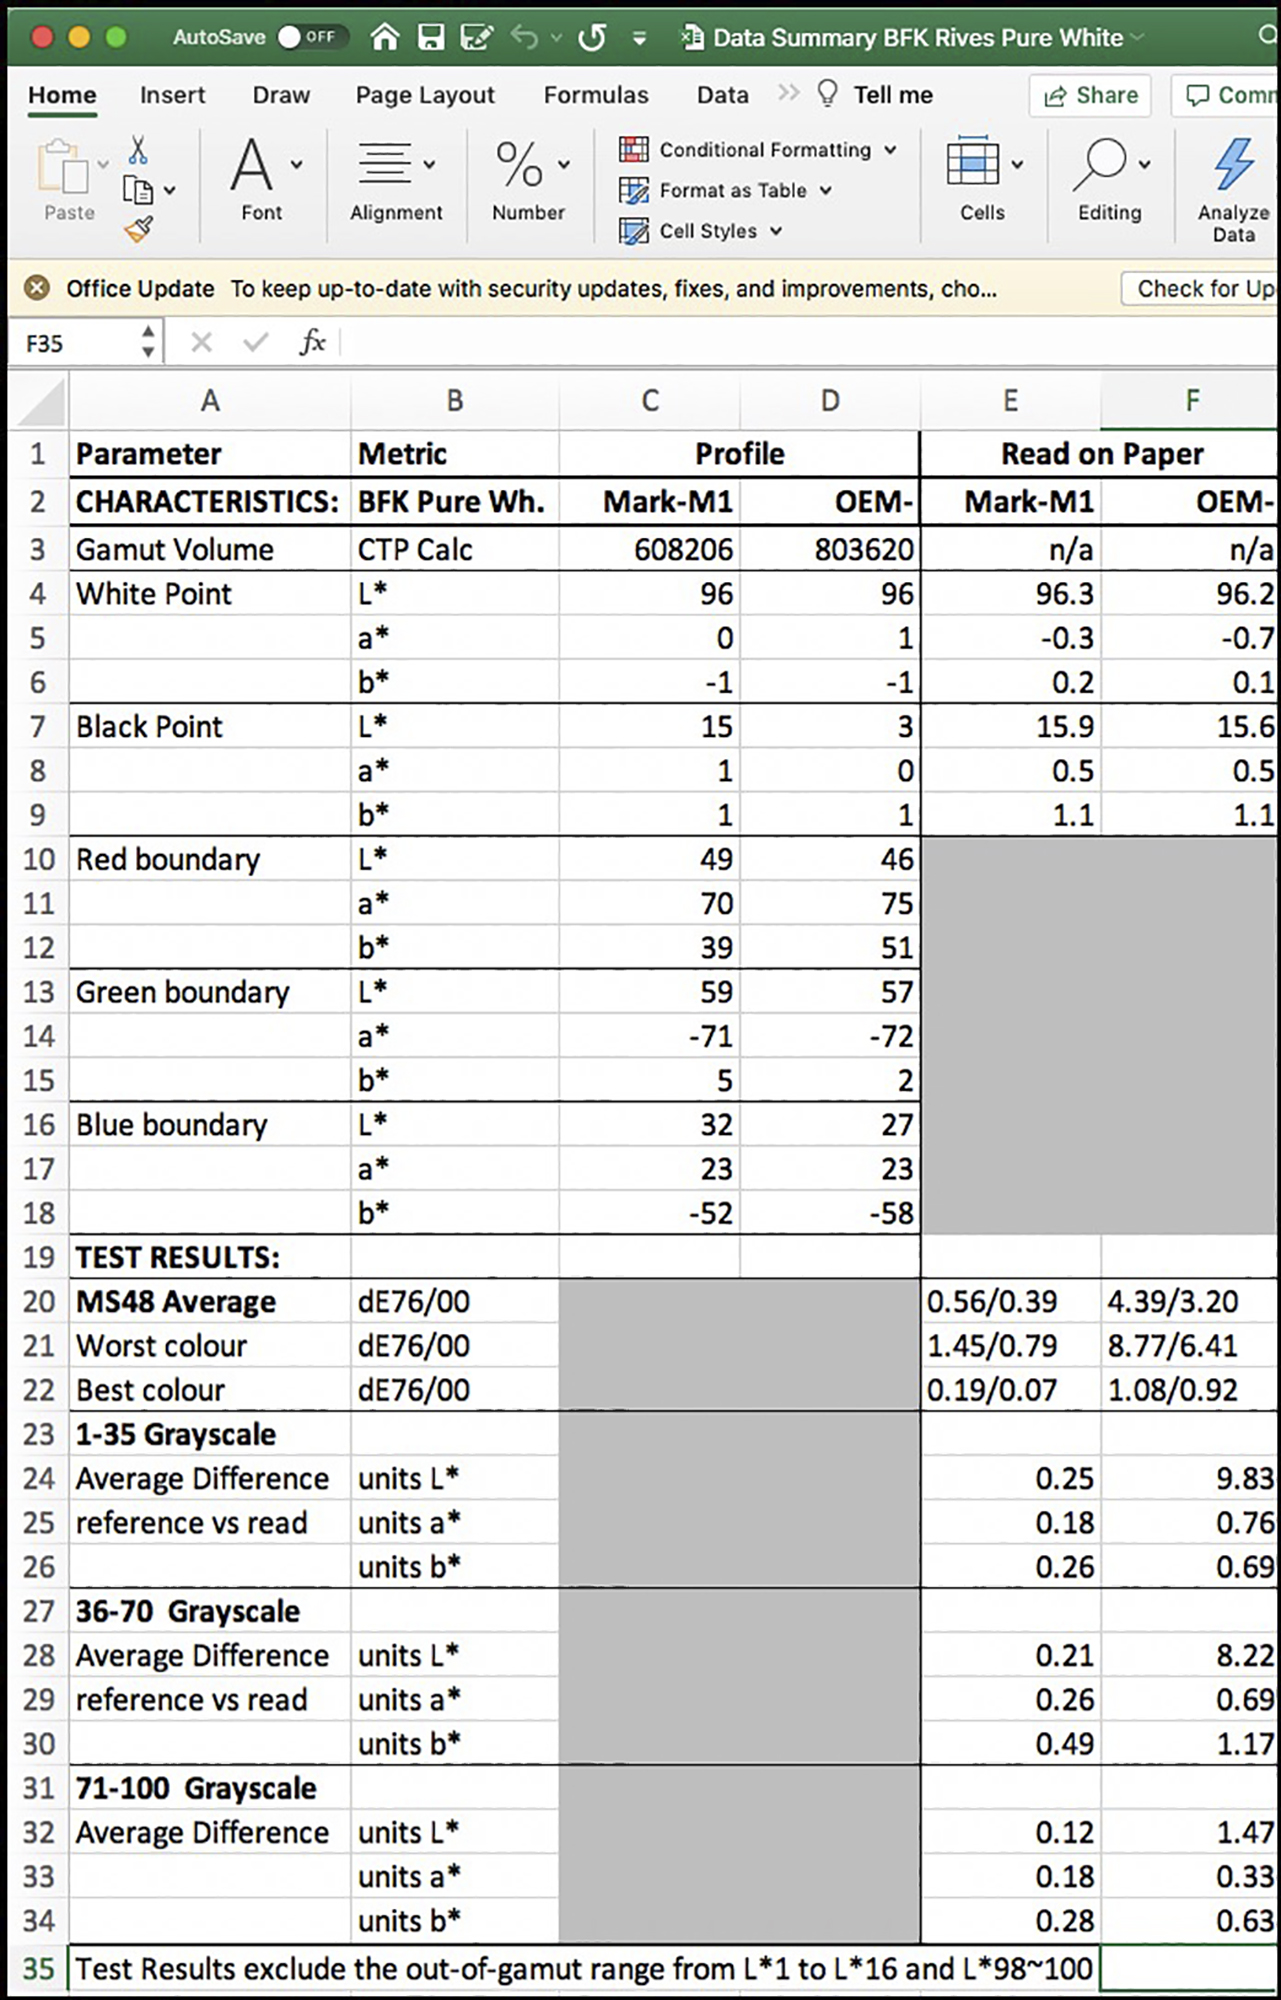
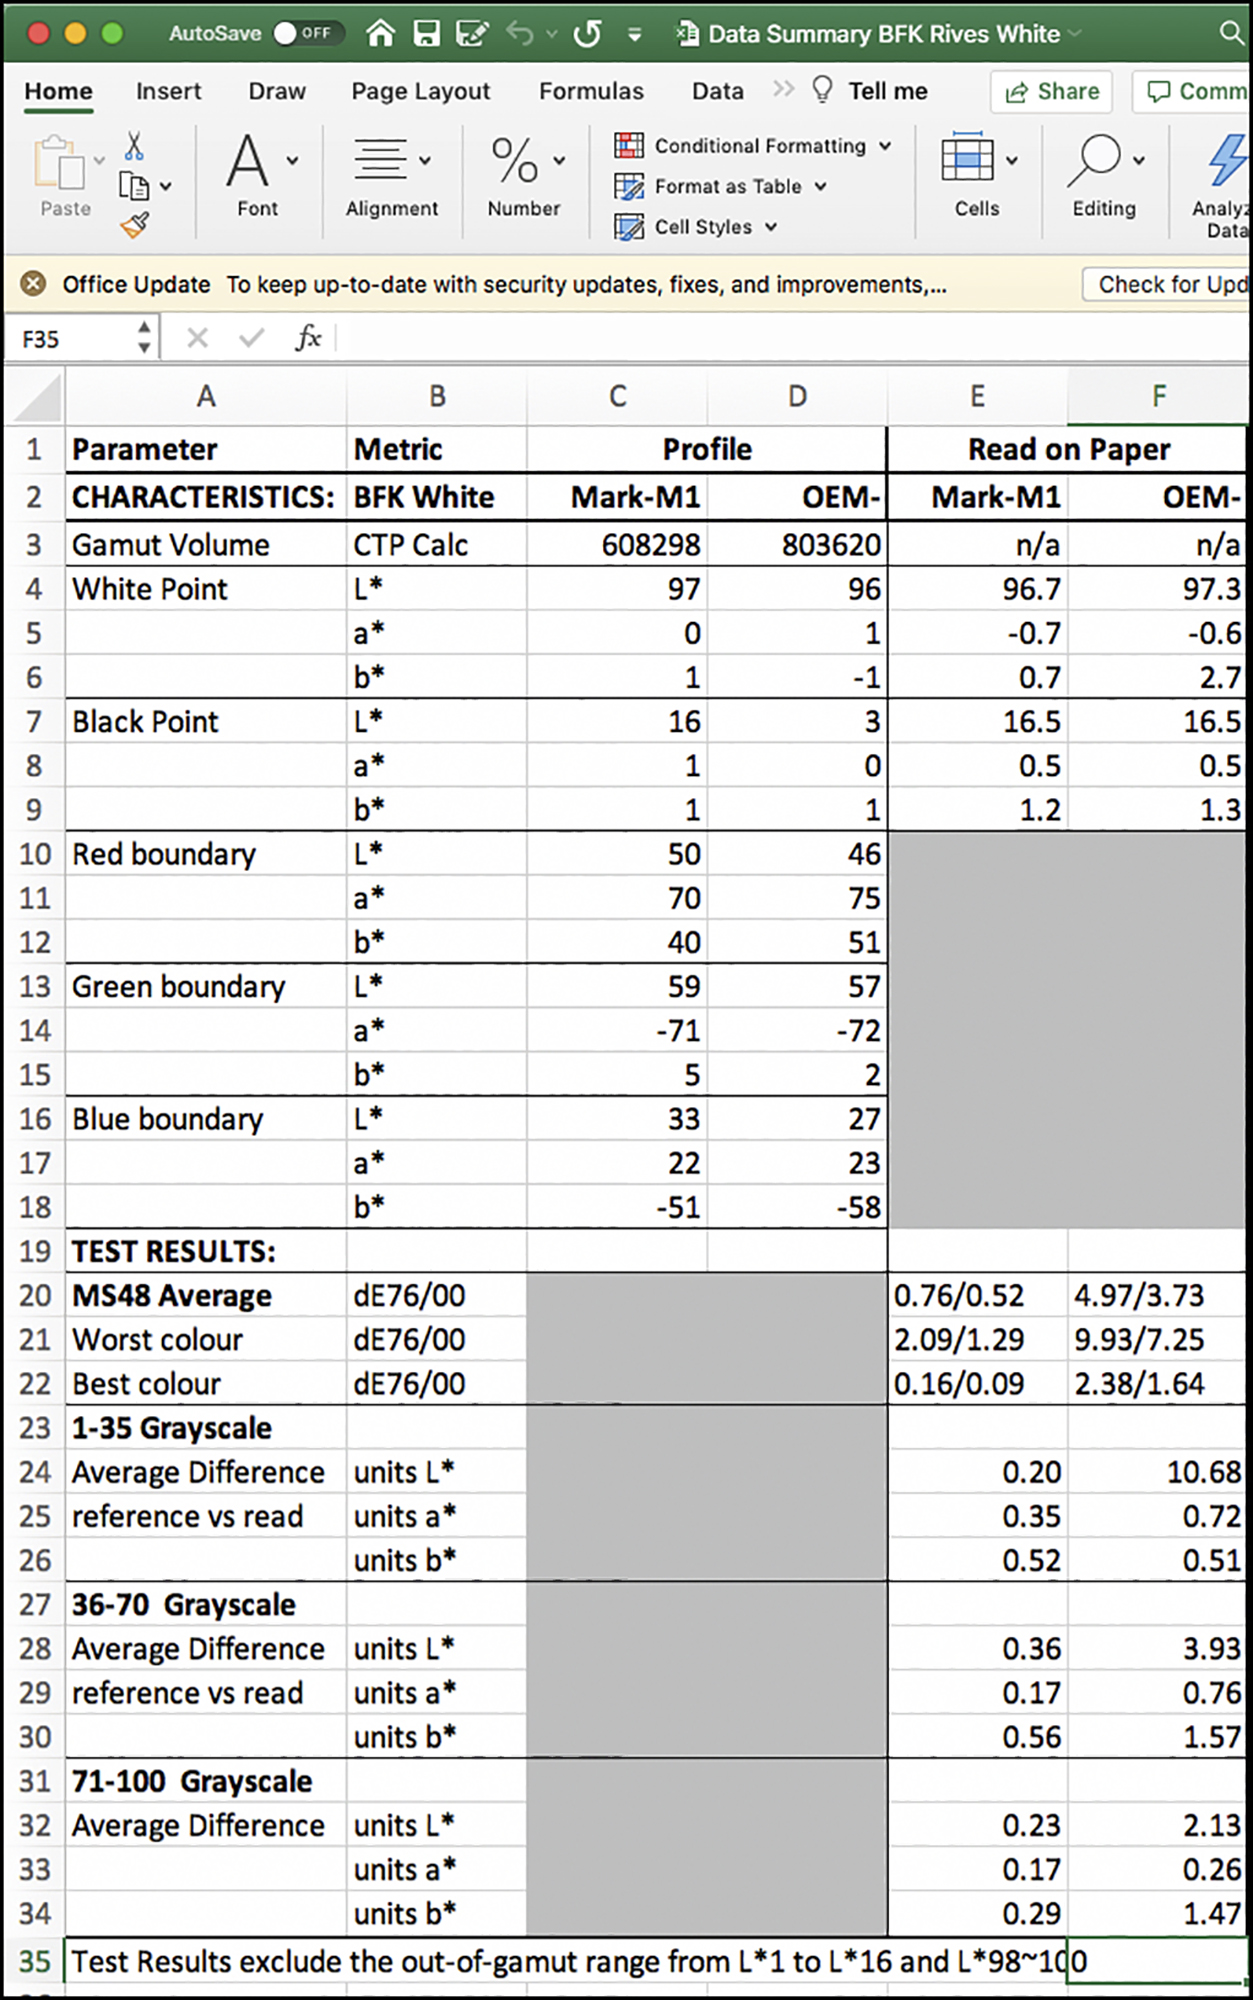
As these are all matte papers, the normal expectation is that gamut volumes would fall within the range of roughly 550,000~650,000 (ColorThink Pro calculation), and the Black Point would be in the range of L*14~L*16. That is indeed the case for the custom profiles I made, but not so for the OEM (i.e. Canson) profiles, for which gamut volume is much higher and Black Point much lower (Figure 1 cells C3 versus D3 and C7 versus D7).
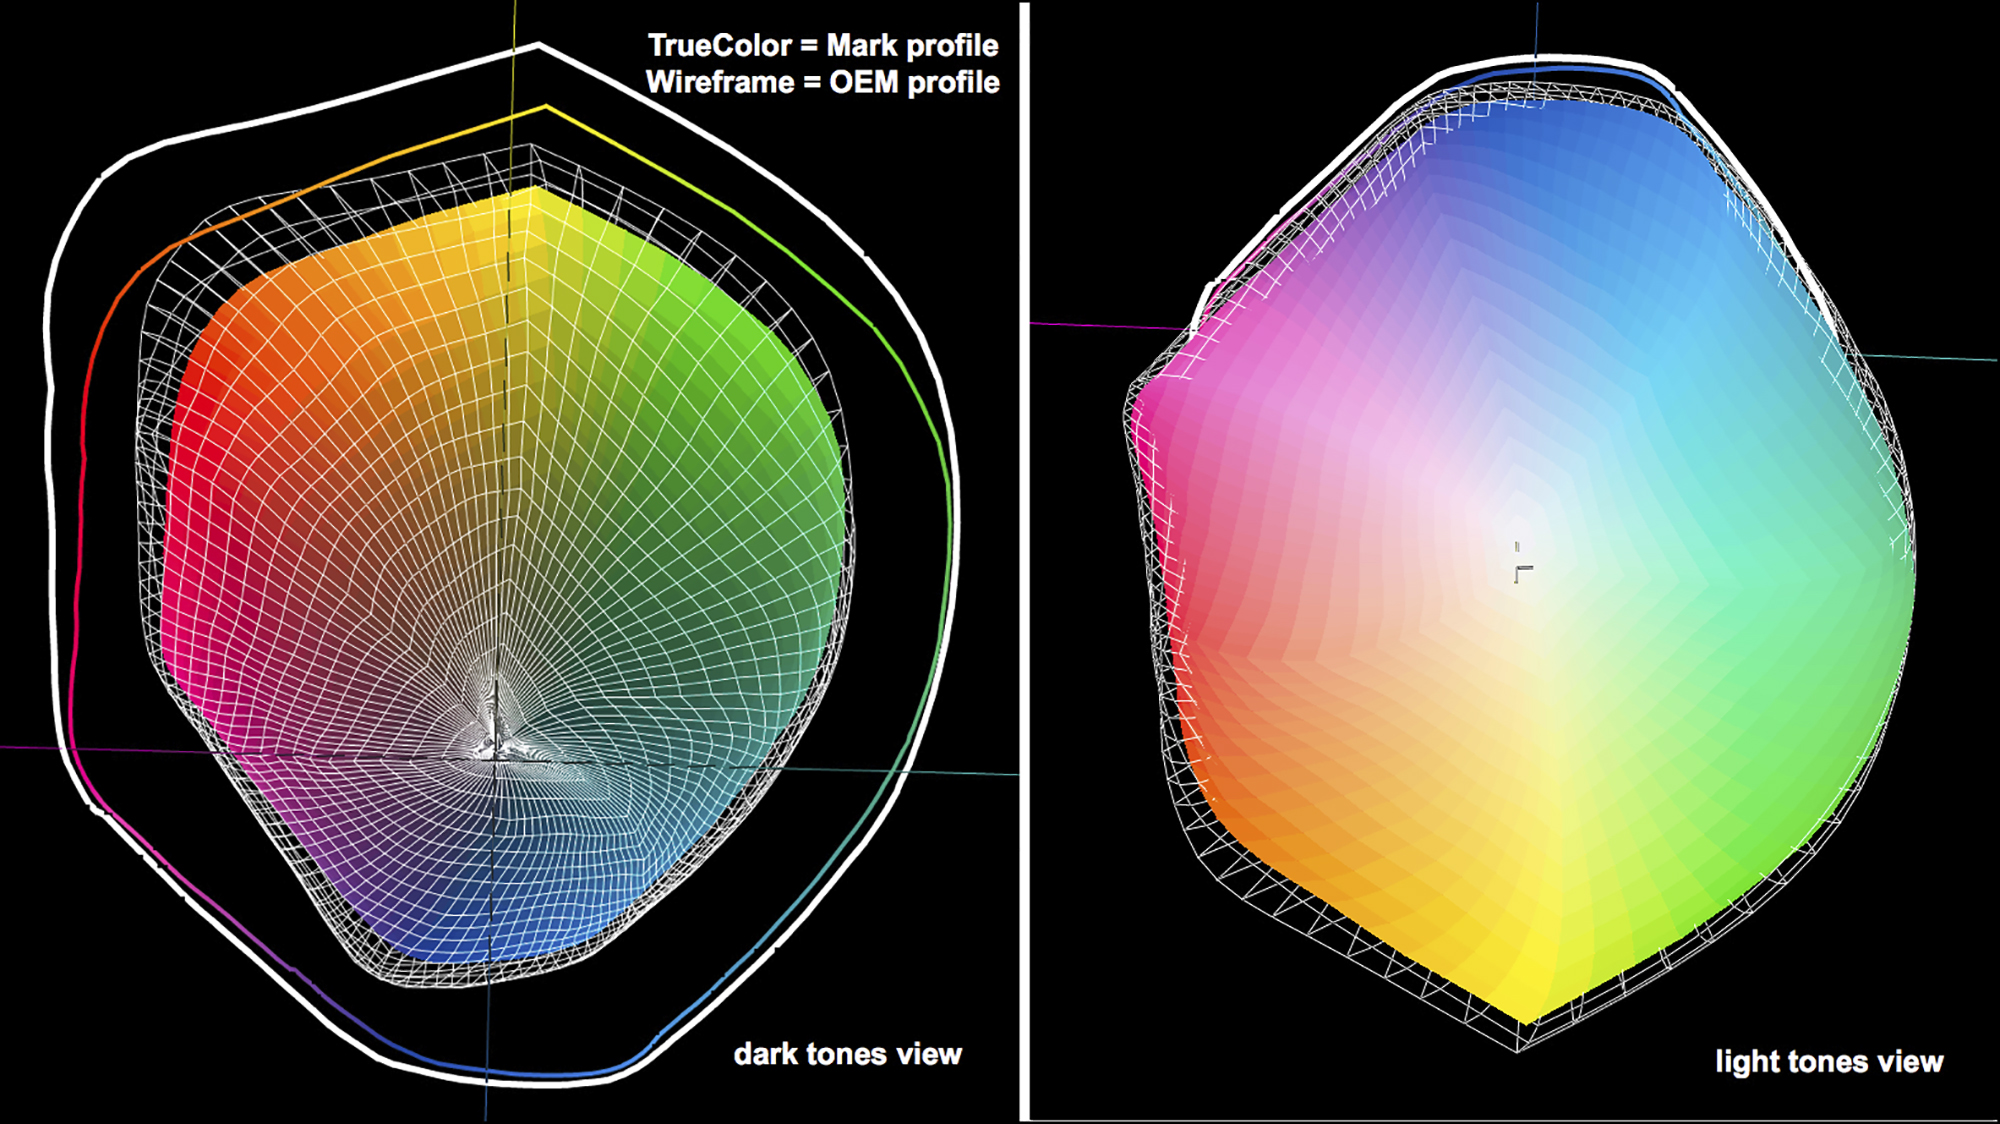
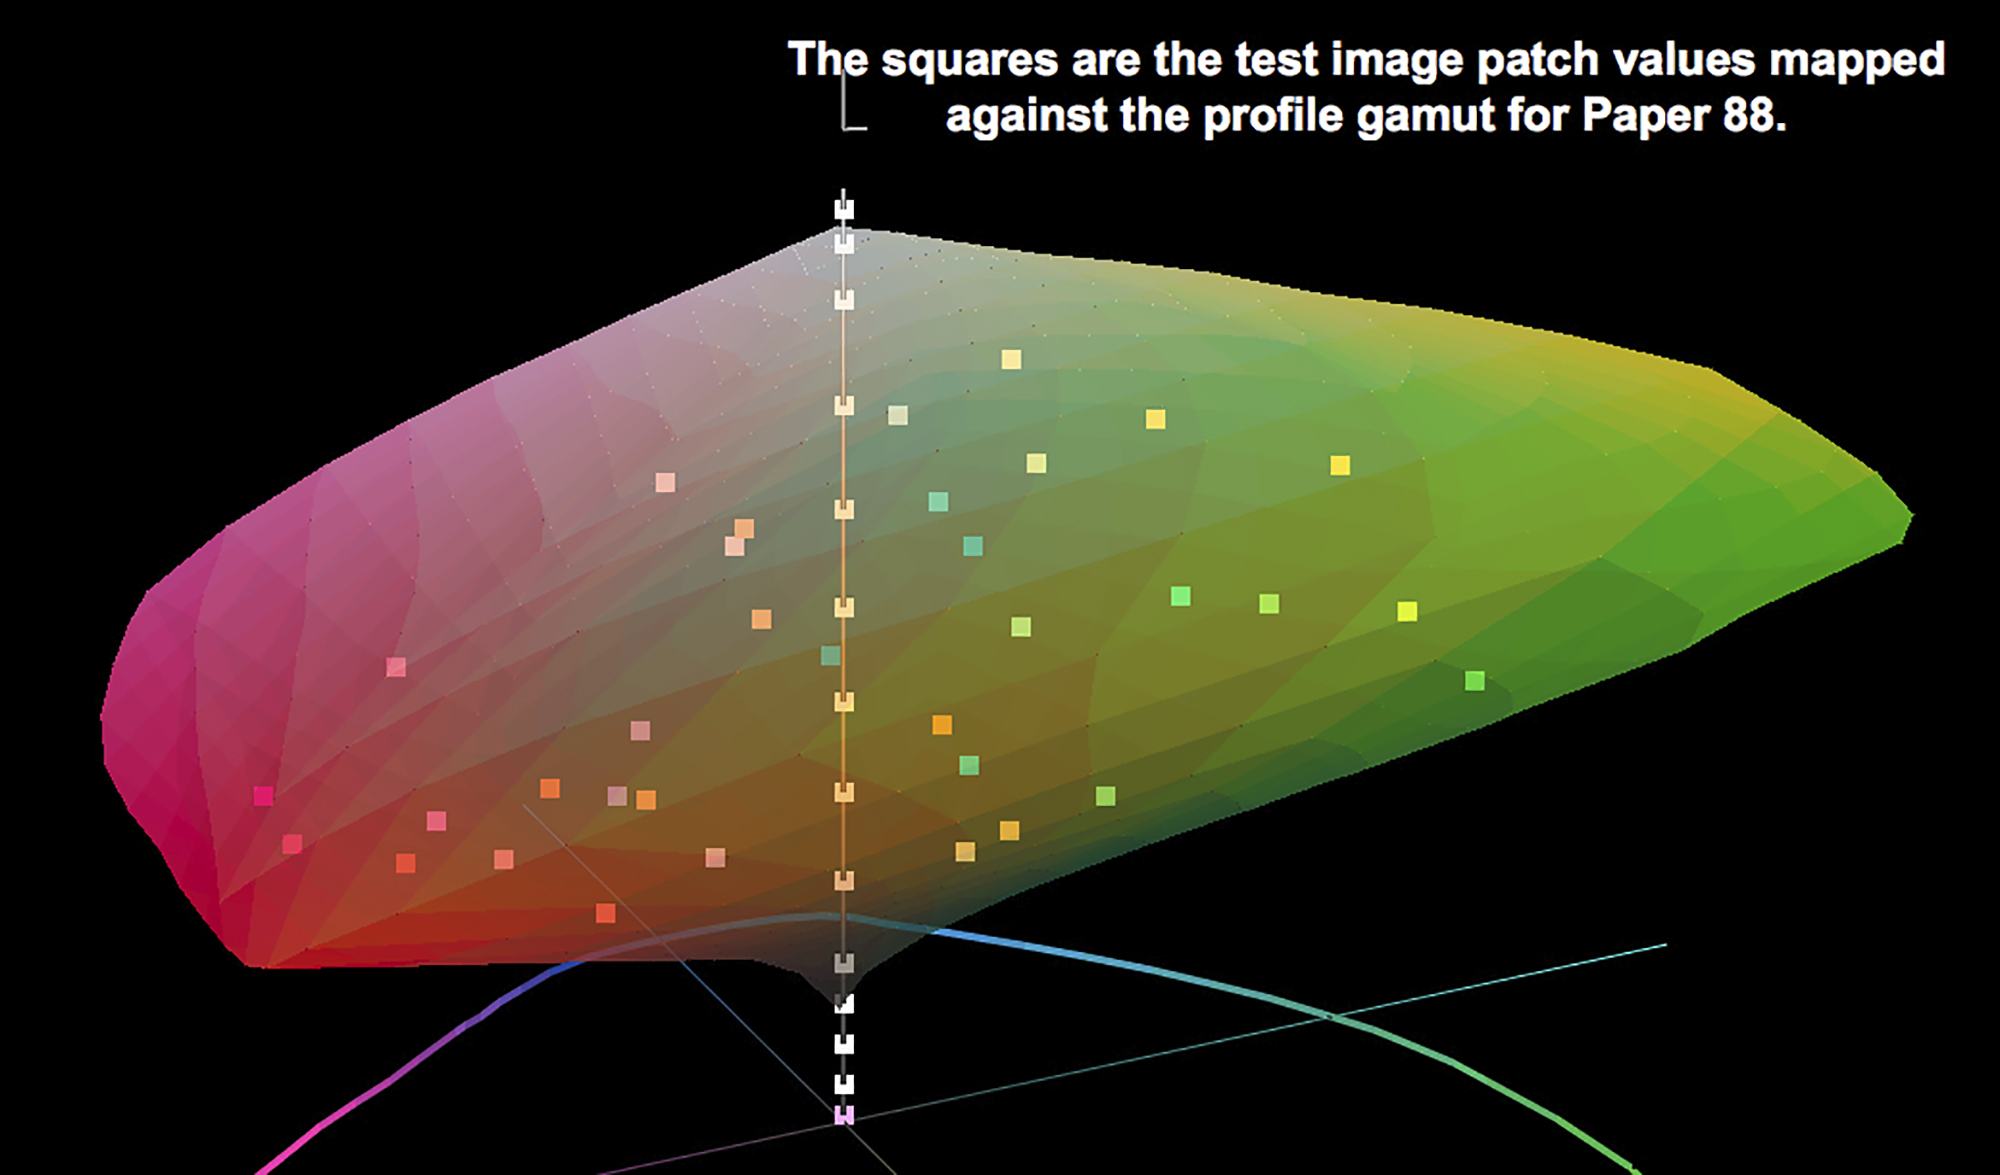
Figure 5 shows a gamut plot comparison for 88 Custom versus OEM profiles; the same general picture applies to all four papers. It shows how the darker portion of the gamut is considerably larger for the OEM profile, with a deeper Black point. Also notice how the portrayed colour gamut volume difference is larger in the red-yellow-lime parts of the hue spectrum and much closer in the green-blue-magenta parts. We’ll see below whether these portrayed differences of gamut volume mean much when comparing printed results from the two profiling approaches.
These above-mentioned differences between the OEM and Custom profiles are due to the difference of profiling measurement conditions used for each. My custom profiles use the M0/M1/M2 measurement conditions, while the OEM profiles are based on M3 measurement condition, which uses a polarizing filter on the spectrophotometer for reading the profiling targets. (For a more detailed discussion of M3 versus M0/M1/M2 measurement conditions and their implications, please visit my article on Red River Palo Duro Baryta Fiber 300 paper (https://photopxl.com/red-river-palo-duro-baryta-fiber-300/).
Canson chose to use M3 rather than M0/M1/M2 measurement conditions because they are of the view that (i) with its deeper Black Point, M3 provides superior separation of detail in the lower quartertones and (ii) it offers superior grayscale neutrality. I’ve tested for all of this rather carefully, and we’ll see below what practical differences to outcomes these different profiling approaches make. It’s interesting.
For now, it’s important to bear in mind the following: normally, people do not view prints through a polarizing filter. Measurement conditions M0/M1/M2 approximately simulate normal viewing conditions – i.e. how we would see colours reflected from a print be it using D65 or D50 lighting, with or without the effects of optical brightening agents and without polarizers. M3 reads the colours through a polarizer. The M3 profiling condition therefore does not create profiles based on lighting for normal viewing conditions. In particular, when the printed results of M3 profiles are read with M1 measurement condition (I’m using an i1Pro3 spectrophotometer), the results will look more inaccurate in the statistics than they appear on paper; we will be examining this in some detail below.
So taking e.g. paper 88 again, you’ll notice in Figure 1 cells E7 and F7 (Custom and OEM profiles) how the Black Points, read with M1 measurement condition, are very close at L*15.5 and 16.1 for the Custom and OEM profiles respectively – i.e., the measured Black Point rendered from the traditional M1 profile is a tad darker than that for the M3 profile. Regarding neutrality of the Black Point, the tint and temperature readings are the same and slightly warm. White Points are quite close and quite neutral between the four papers and the two profiling methods.
Comparing between papers using M1 measurement condition, the profile characteristics are similar for all four. The relative differences between the Custom and OEM profiles for each of the four papers are also similar. These profile characteristics are well within the expected range for these kinds of papers.
The next subject of this review is the estimated accuracy of the printing system including these papers and their respective profiles. For this I turn to the lower sections of Figures 1 to 4, “TEST RESULTS”. “Accuracy” here only means how closely the printed values of the test patches match the values of those patches in their reference image file, based on dE(2000). I focus on dE(2000) evaluation results, because X-Rite most likely optimized the profiling calculations in i1Profiler around dE(2000). Nonetheless, I also show dE(76) outcomes.
Starting with my 48-patch target for evaluating accuracy of the printing system (colours represented in Column “O” of Fig. 7), the first step is to verify that the target patches are within the Custom profile gamut. Figure 6, compiled in ColorThink Pro, shows that they are, except for the four darkest levels (L*1, 5, 10, 15) and the whitest patch in the grayscale, which are out of paper/profile gamut for M0/M1/M2 measurement conditions and therefore excluded from the dE calculations below. This picture would be pretty much the same for all four papers under the same measurement conditions (M0/M1/M2). As the polarized printer profile gamut volumes are larger, the test patches are even more securely in gamut, except 1 black and 1 white patch.
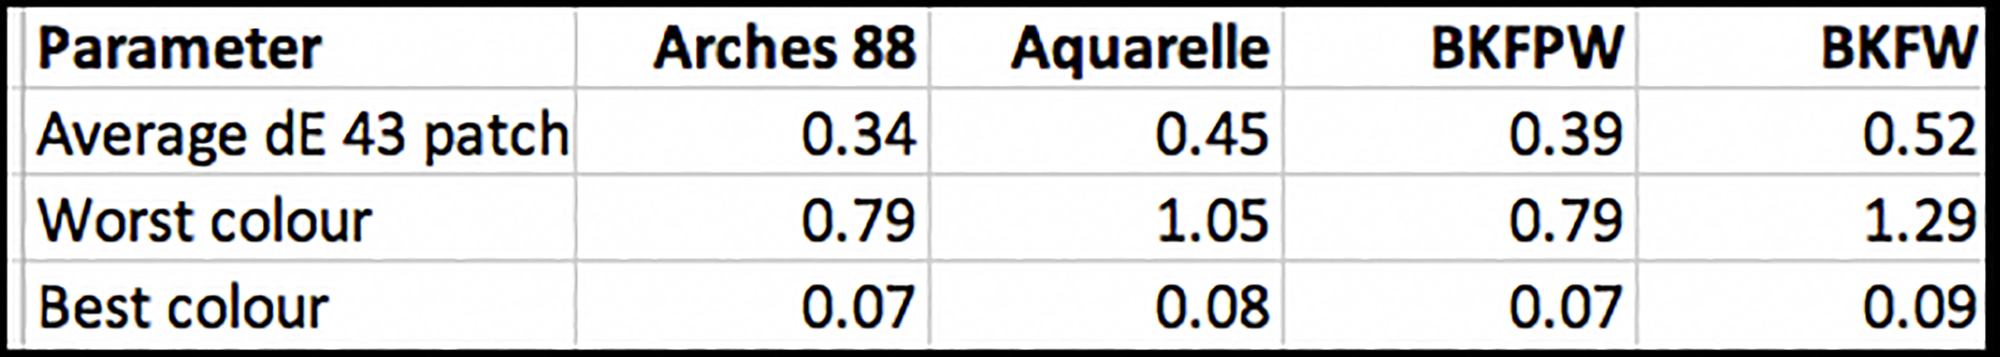
Reverting to Figure 1 for Paper 88, cells E(20, 21, 22) and F(20, 21,22) show the overall dE results for the Custom and OEM profiles respectively, including only the 43 in-gamut patches. For the Custom M1 profile the average dE(2000) is a very low 0.34 (the lower the dE the closer the match between target and printed values), the least accurate colour having dE 0.79 and most accurate 0.07. This is a stellar outcome, giving confidence that the printing system including this paper and profile can produce accurate reproduction of the photograph’s colour values. Figure 7 shows the detailed results.
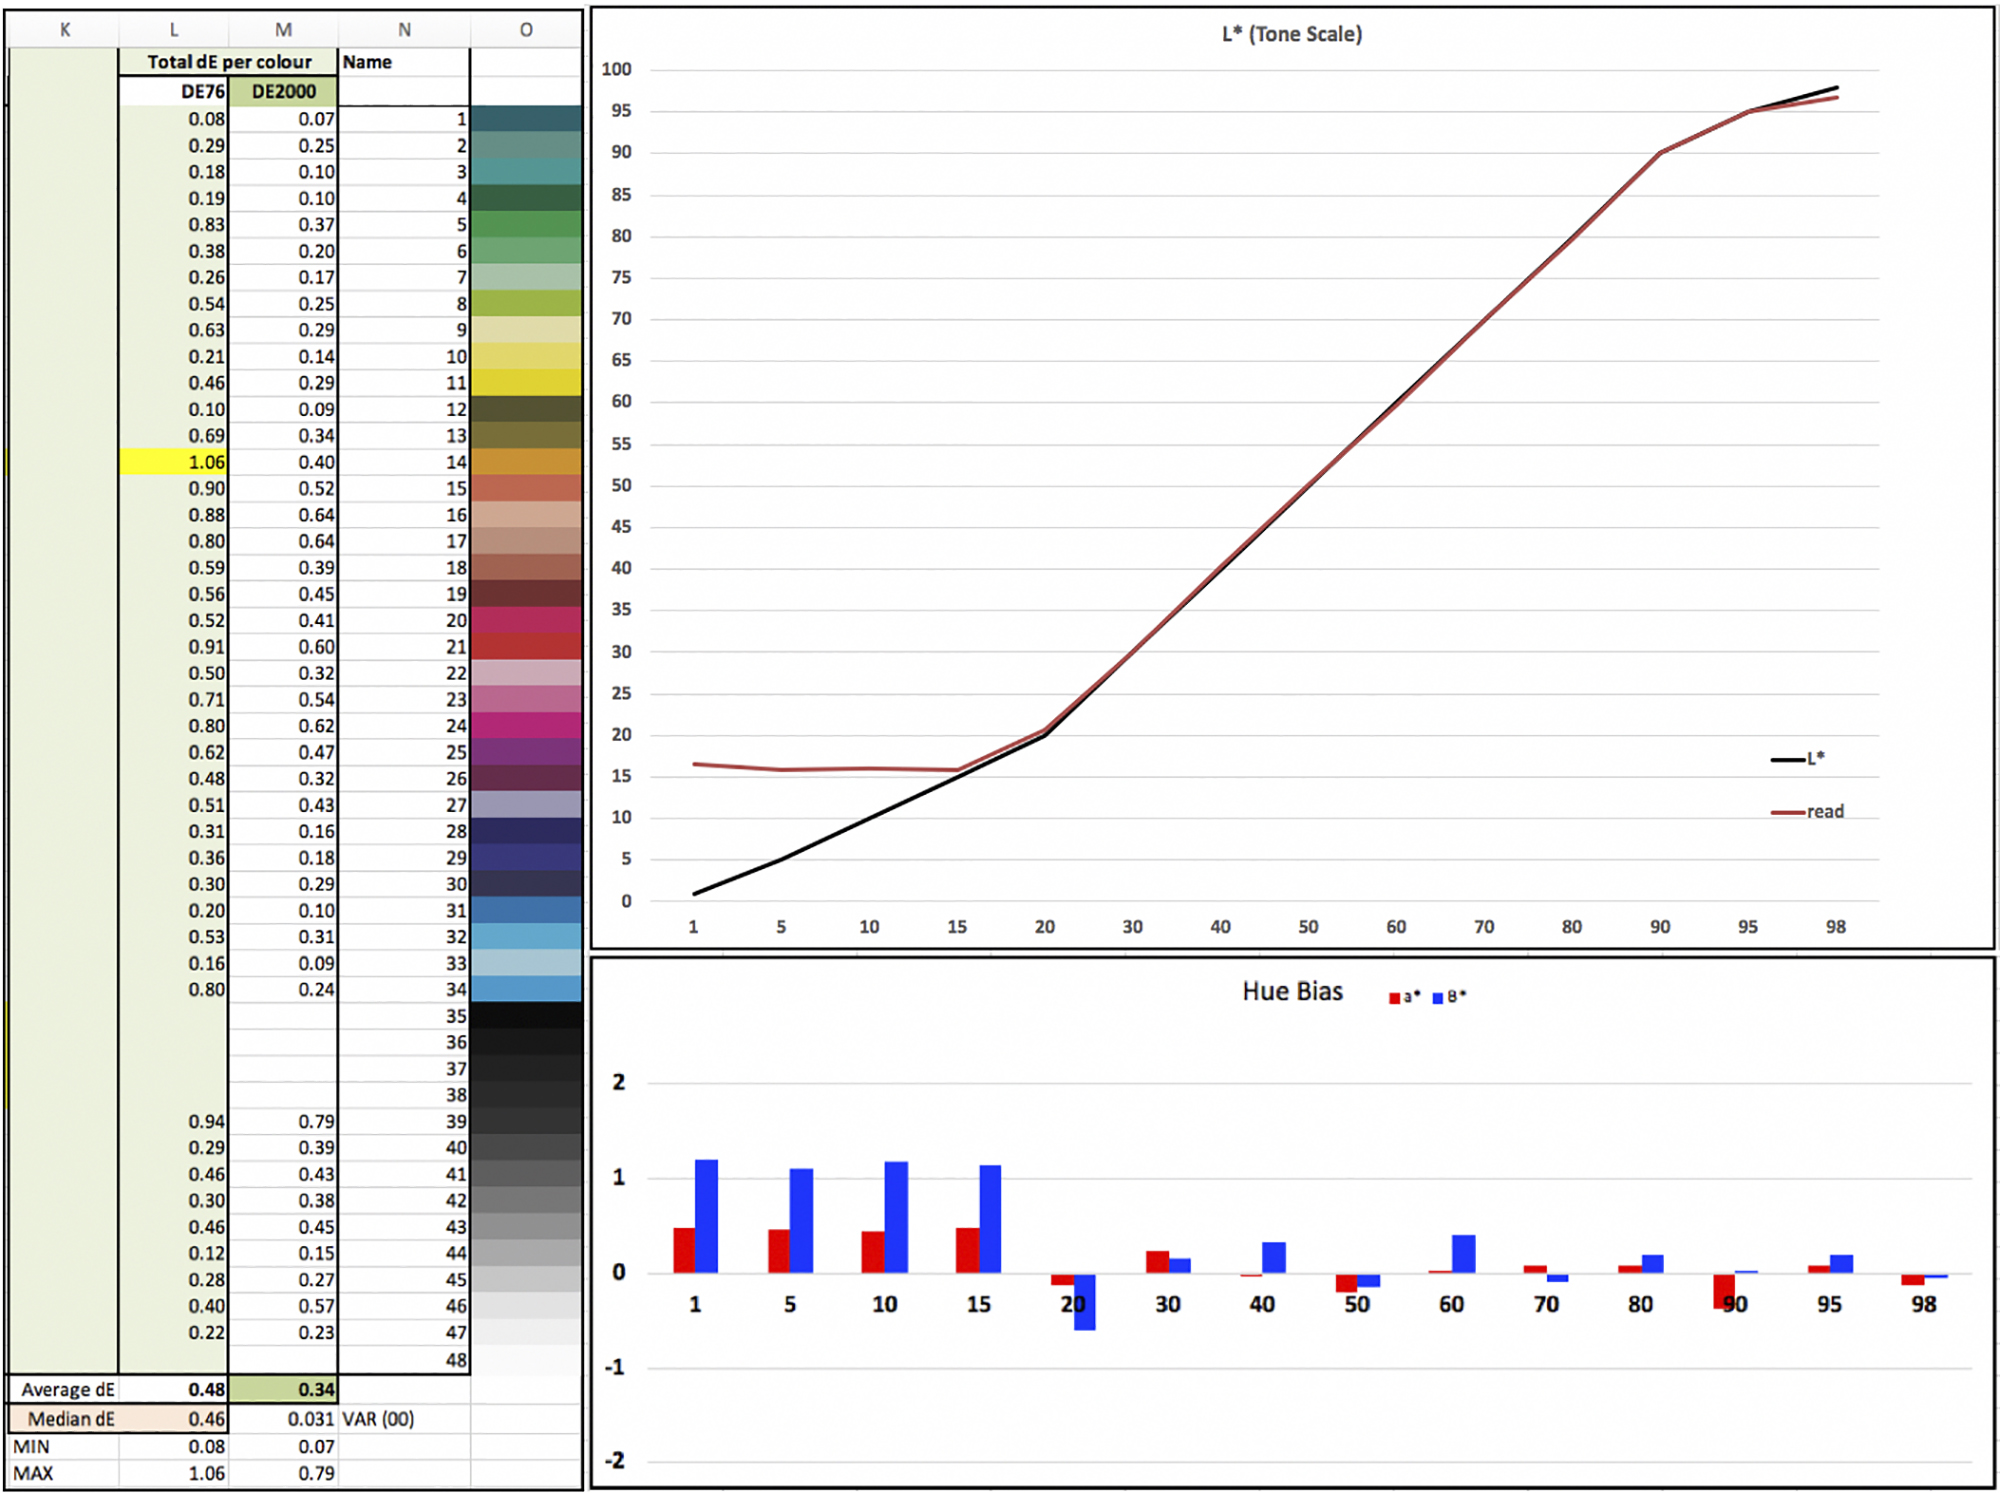
The left panel of Figure 7 shows the individual and average dE values for the 43 measured patches. The top right panel shows the reference (Black line) and measured (Red line) values for the Luminance of the grayscale (patches 35 to 48). If the red and black lines converge it means the measured values on paper are the same as the file values, hence accurate and with smooth linear tonal gradation. The lower and upper ends of these curves show the gamut limitations typical of matte papers, using M0/M1/M2 measurement conditions. The bottom right panel shows the extent of hue bias in the grayscale. Any stretch of the bars to +/- 1.0 indicates variances from neutral gray that normal people would not perceive as such, hence would look neutral gray on paper. As you can see, this paper profiles beautifully for both B&W and colour, and produces excellent prints of real photographs, as we’ll see below.
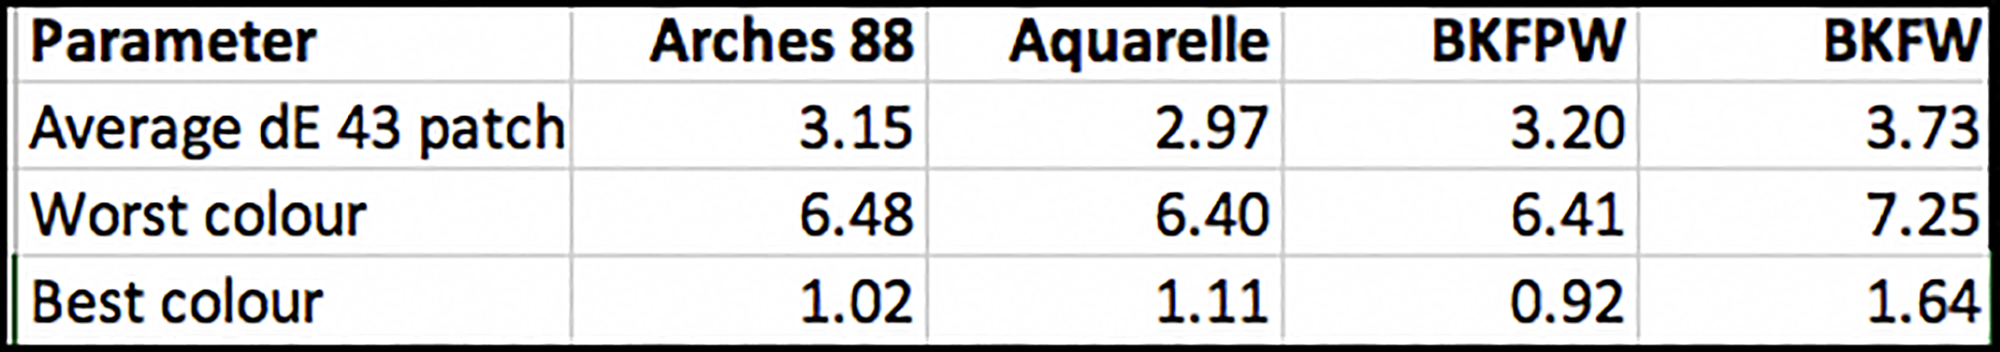
The dE results for the OEM profile (Figure 8) are quite different, because they show the printed results of M3 (polarized) profiling read with an instrument that has no polarizing capability. So, here you see from Figure 1 cells F20~F22 that the average dE(2000) result is 3.15, the most inaccurate colour having dE of 6.48 and the most accurate colour 1.02. Inaccurate results don’t necessarily mean the profile is poor. The results appear statistically inaccurate mainly because the instruments and measurement conditions for creating the profile and reading its results on paper differ.
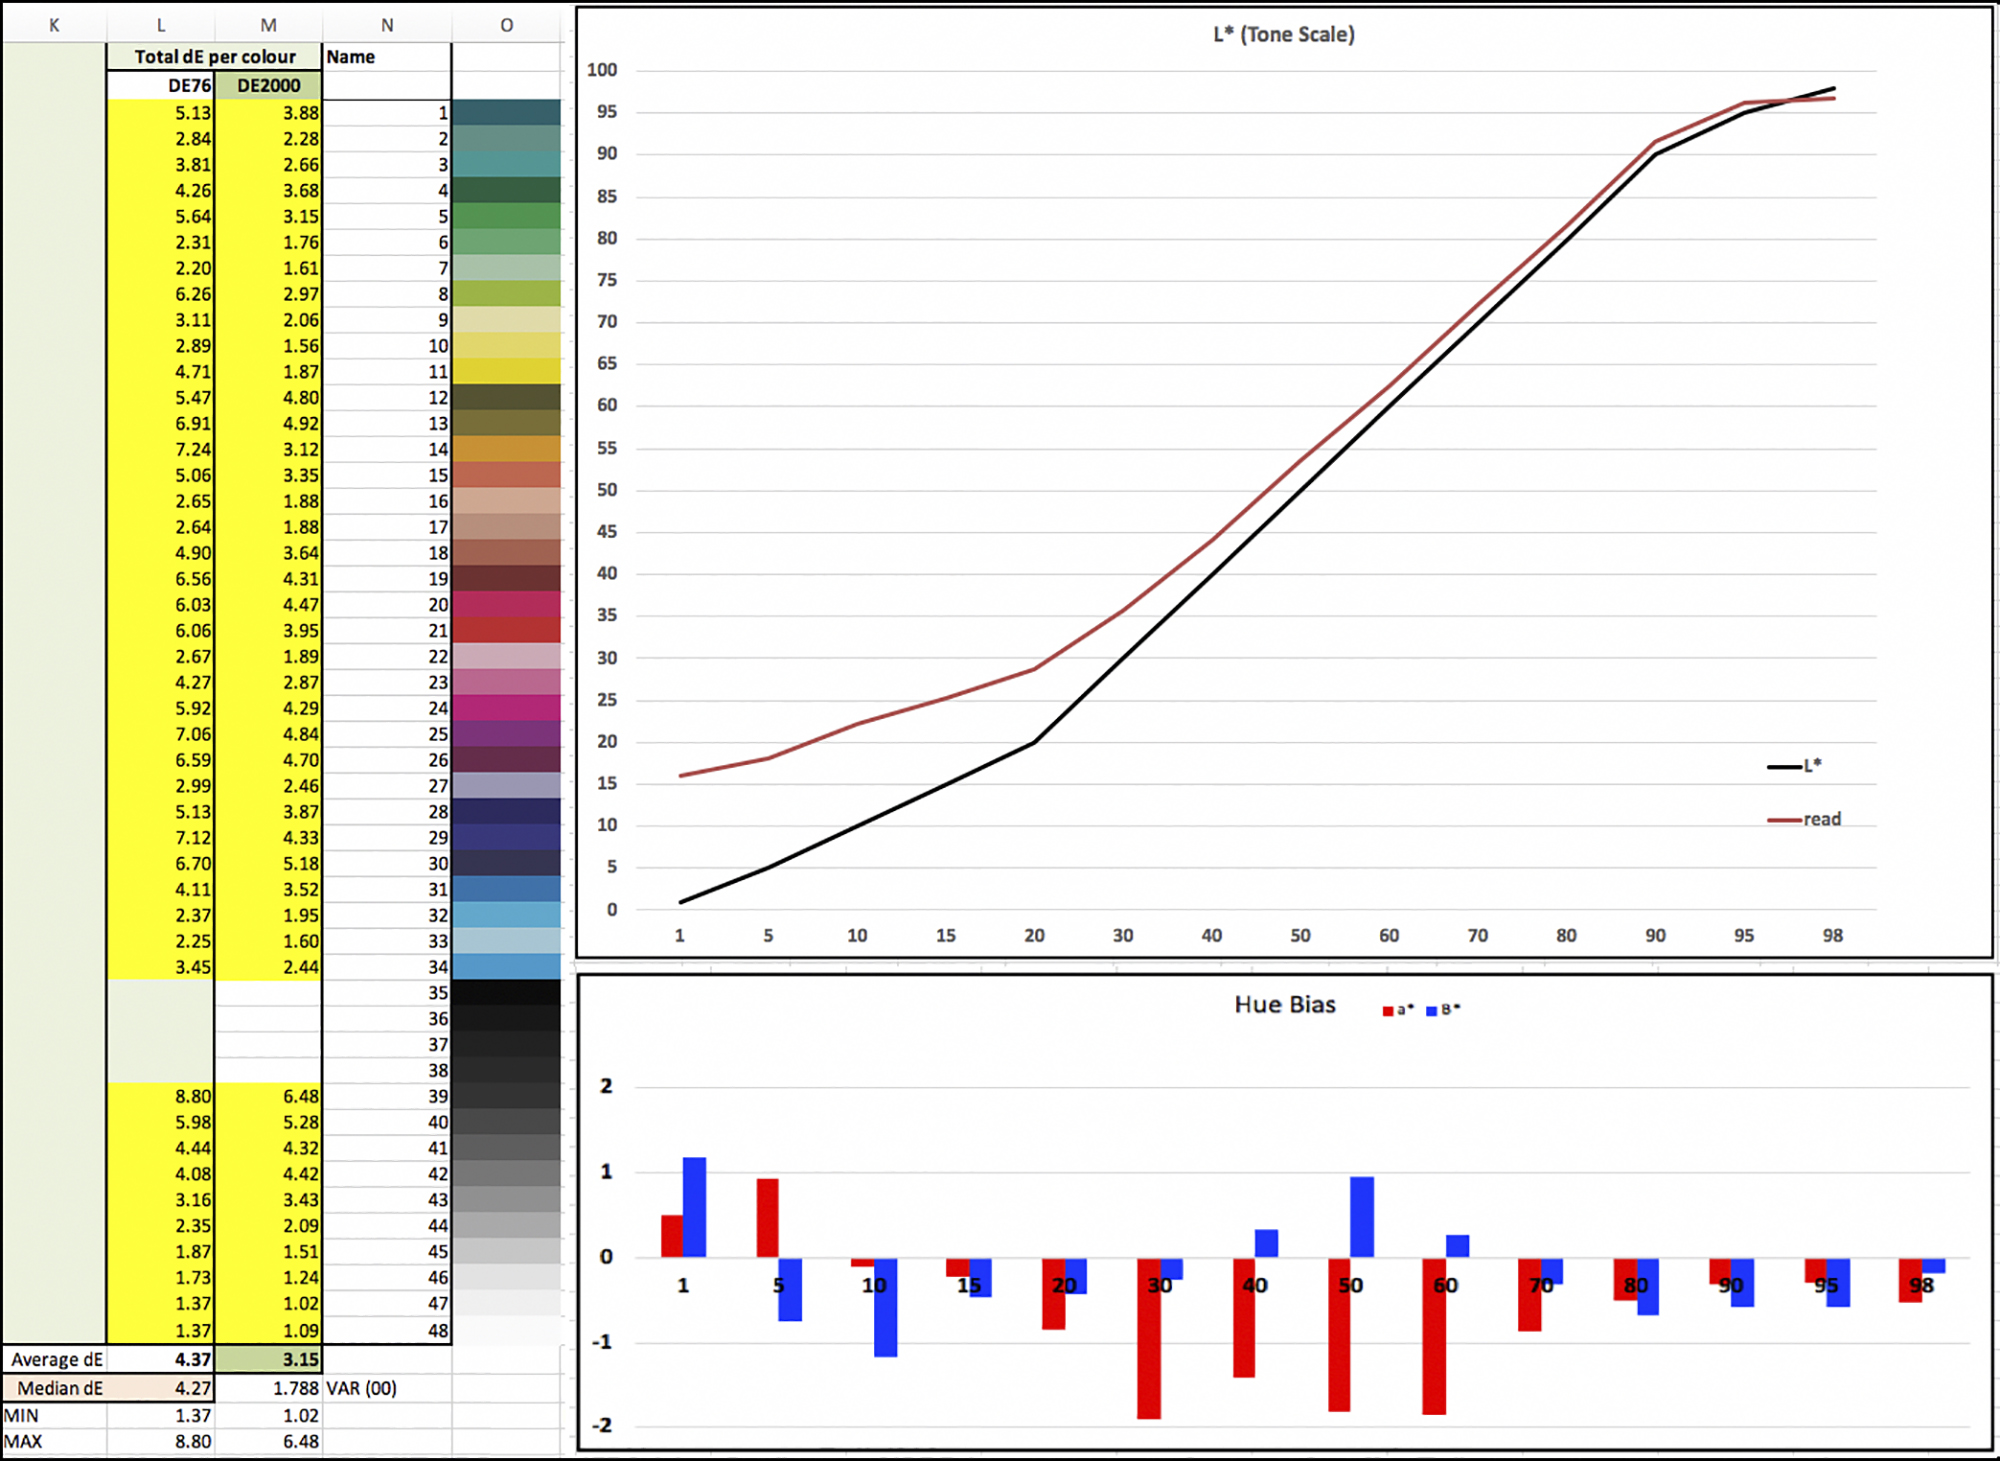
The yellow shading in the left panel of Figure 8 means the values exceed dE 1.0. In the top right panel you can see much greater disconnection between the Black and Red lines measuring the differences between reference and read values for grayscale Luminance. In the lower right panel a number of the bars in the mid-tones indicate a moderately noticeable greenish cast (negative red bar values). But don’t conclude yet about how this profile performs in print, because the print settings create another layer of transformation that influences the appearance of results on paper. More on that below.
As well, it makes a big difference to statistical outcomes whether the measurement condition in which the profile was made matches the measurement condition in which the profile is evaluated. Because I am well aware of the potential impact of such mismatches, I asked Legion Paper (Canson’s North American service partner) if they would kindly cooperate with me in producing an M3 evaluation of their M3 profile using my 48-patch evaluation target. They did so, and the results are most interesting, confirming my expectations (Figure 8(a) for Arches 88.)
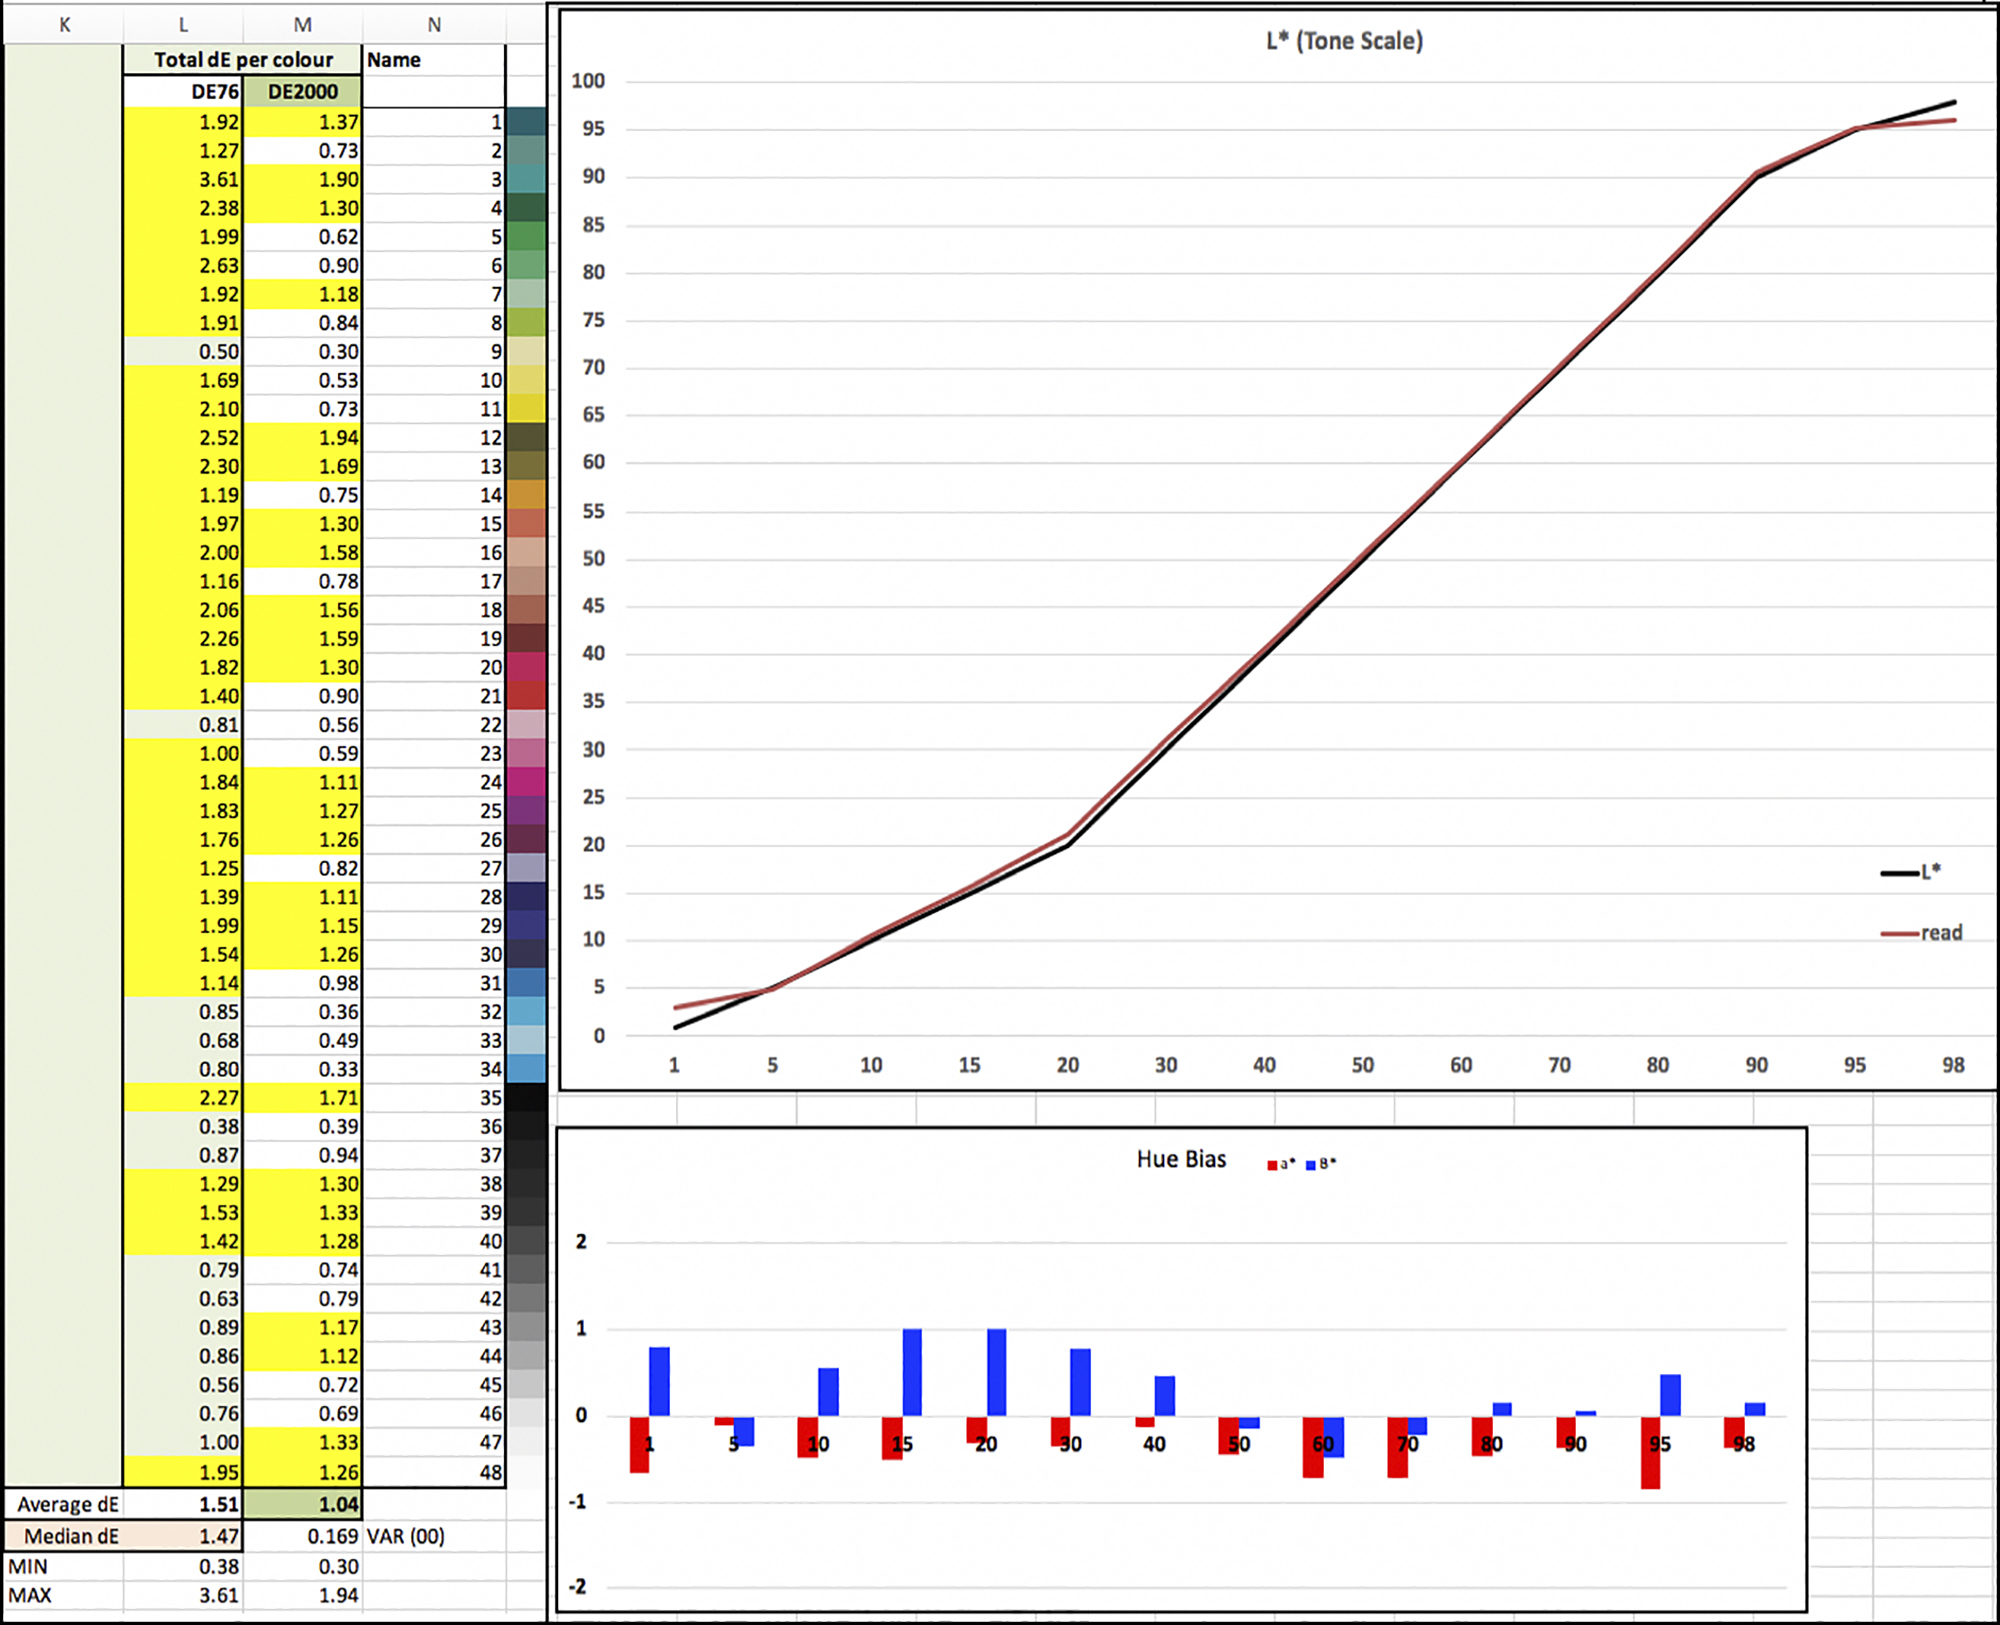
Figure 8a shows a much better interpretation of what M3 profiling does when evaluated with an M3 spectrophotometer. The dE(2000) decreases from 3.15 to 1.04, the worst colour having only dE 1.94 (versus 6.48 in Figure 8) and the best colour 0.3. So, M3 profiling is technically accurate enough in its own right; but since the viewing condition is unusual, I revert to M1 measurement condition in the following observations.
For brevity, I shall not present such a detailed display of the results for the other three papers, because they perform quite similarly to 88. Rather I provide a brief summary of the dE (2000) outcomes described above for all four papers in Figures 9 and 10, M1 condition.
I turn now to a more detailed view of grayscale performance, given the considerable interest in B&W printing, especially on “Fine Art” matte papers.
The grayscale is divided into three zones – dark (L*1-L*35), mid-tone (L*36-L*70) and highlights (L*71-L*100), each showing grayscale gradation in one-level (one L*) increments. The two parameters of interest for the grayscale are Luminance (L*) and hue (a* and b*) for the axes “green to magenta” and “blue to yellow” respectively.
The data in the lower right quadrant of Figures 1-4 above show the absolute average differences between reference and measured values for each zone of the grayscale, for the Custom profiles in Column E and the OEM profiles in Column F. The closer those averages are to zero, the more accurate the rendition of the grayscale target patch values on paper, the smoother the tonal gradations and the more neutral the gray. Figure 11 is a data summary of grayscale characteristics for all four papers.
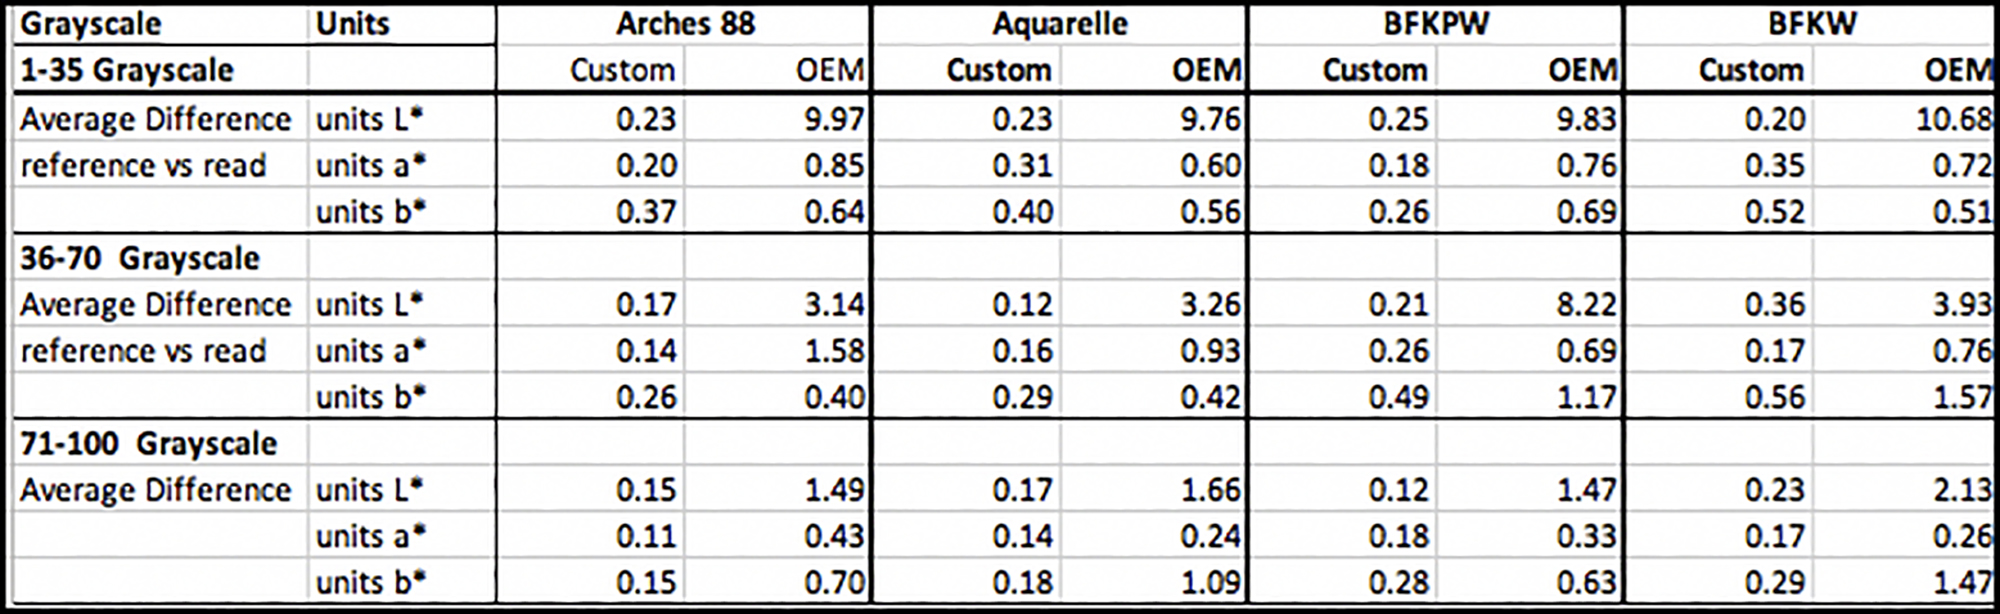
There’s not much difference of performance between the four papers. The general characteristics that emerge from Figure 11 are as follows. (1) In all cases, the custom profiles produce more accurate statistical results than the OEM profiles, for the reasons discussed above in relation to the overall results for all measured colours. (2) For the OEM profiles, the more noticeable discrepancies are for Luminance differences in the dark tones, and to a lesser extent in the mid-tones. (3) Hue neutrality is generally well preserved, more so for the Custom profiles than for the OEM profiles.
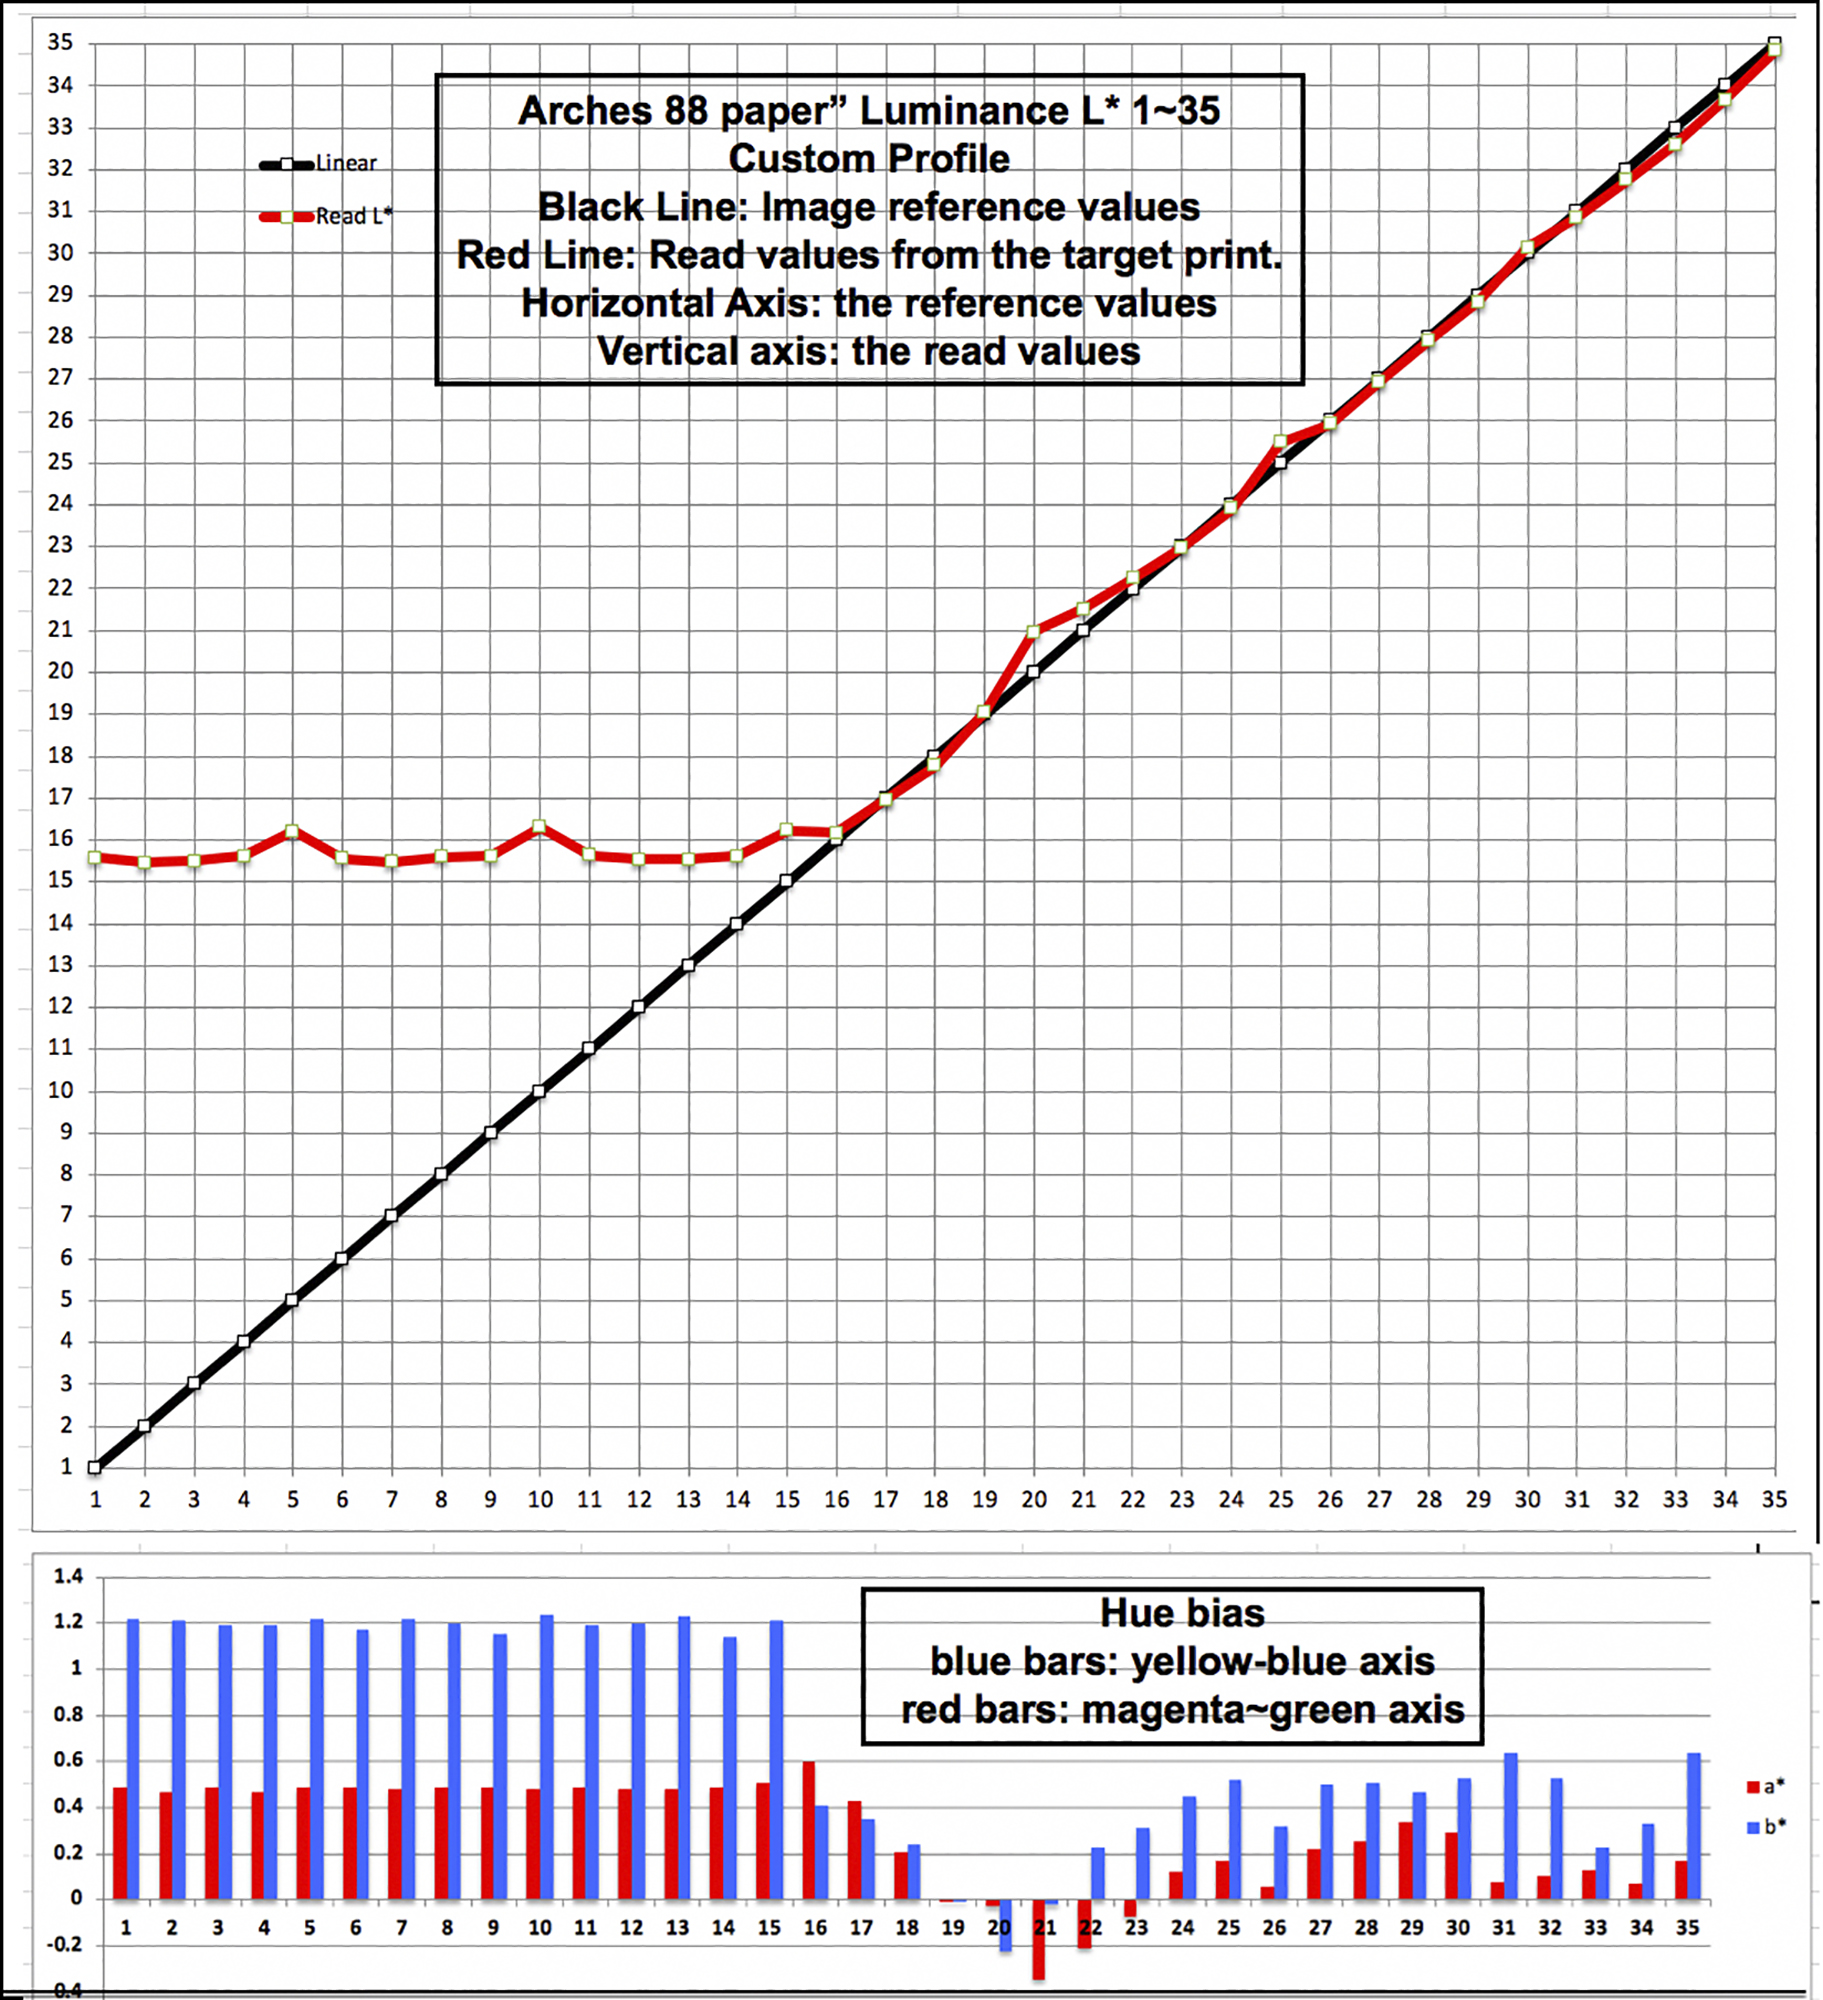
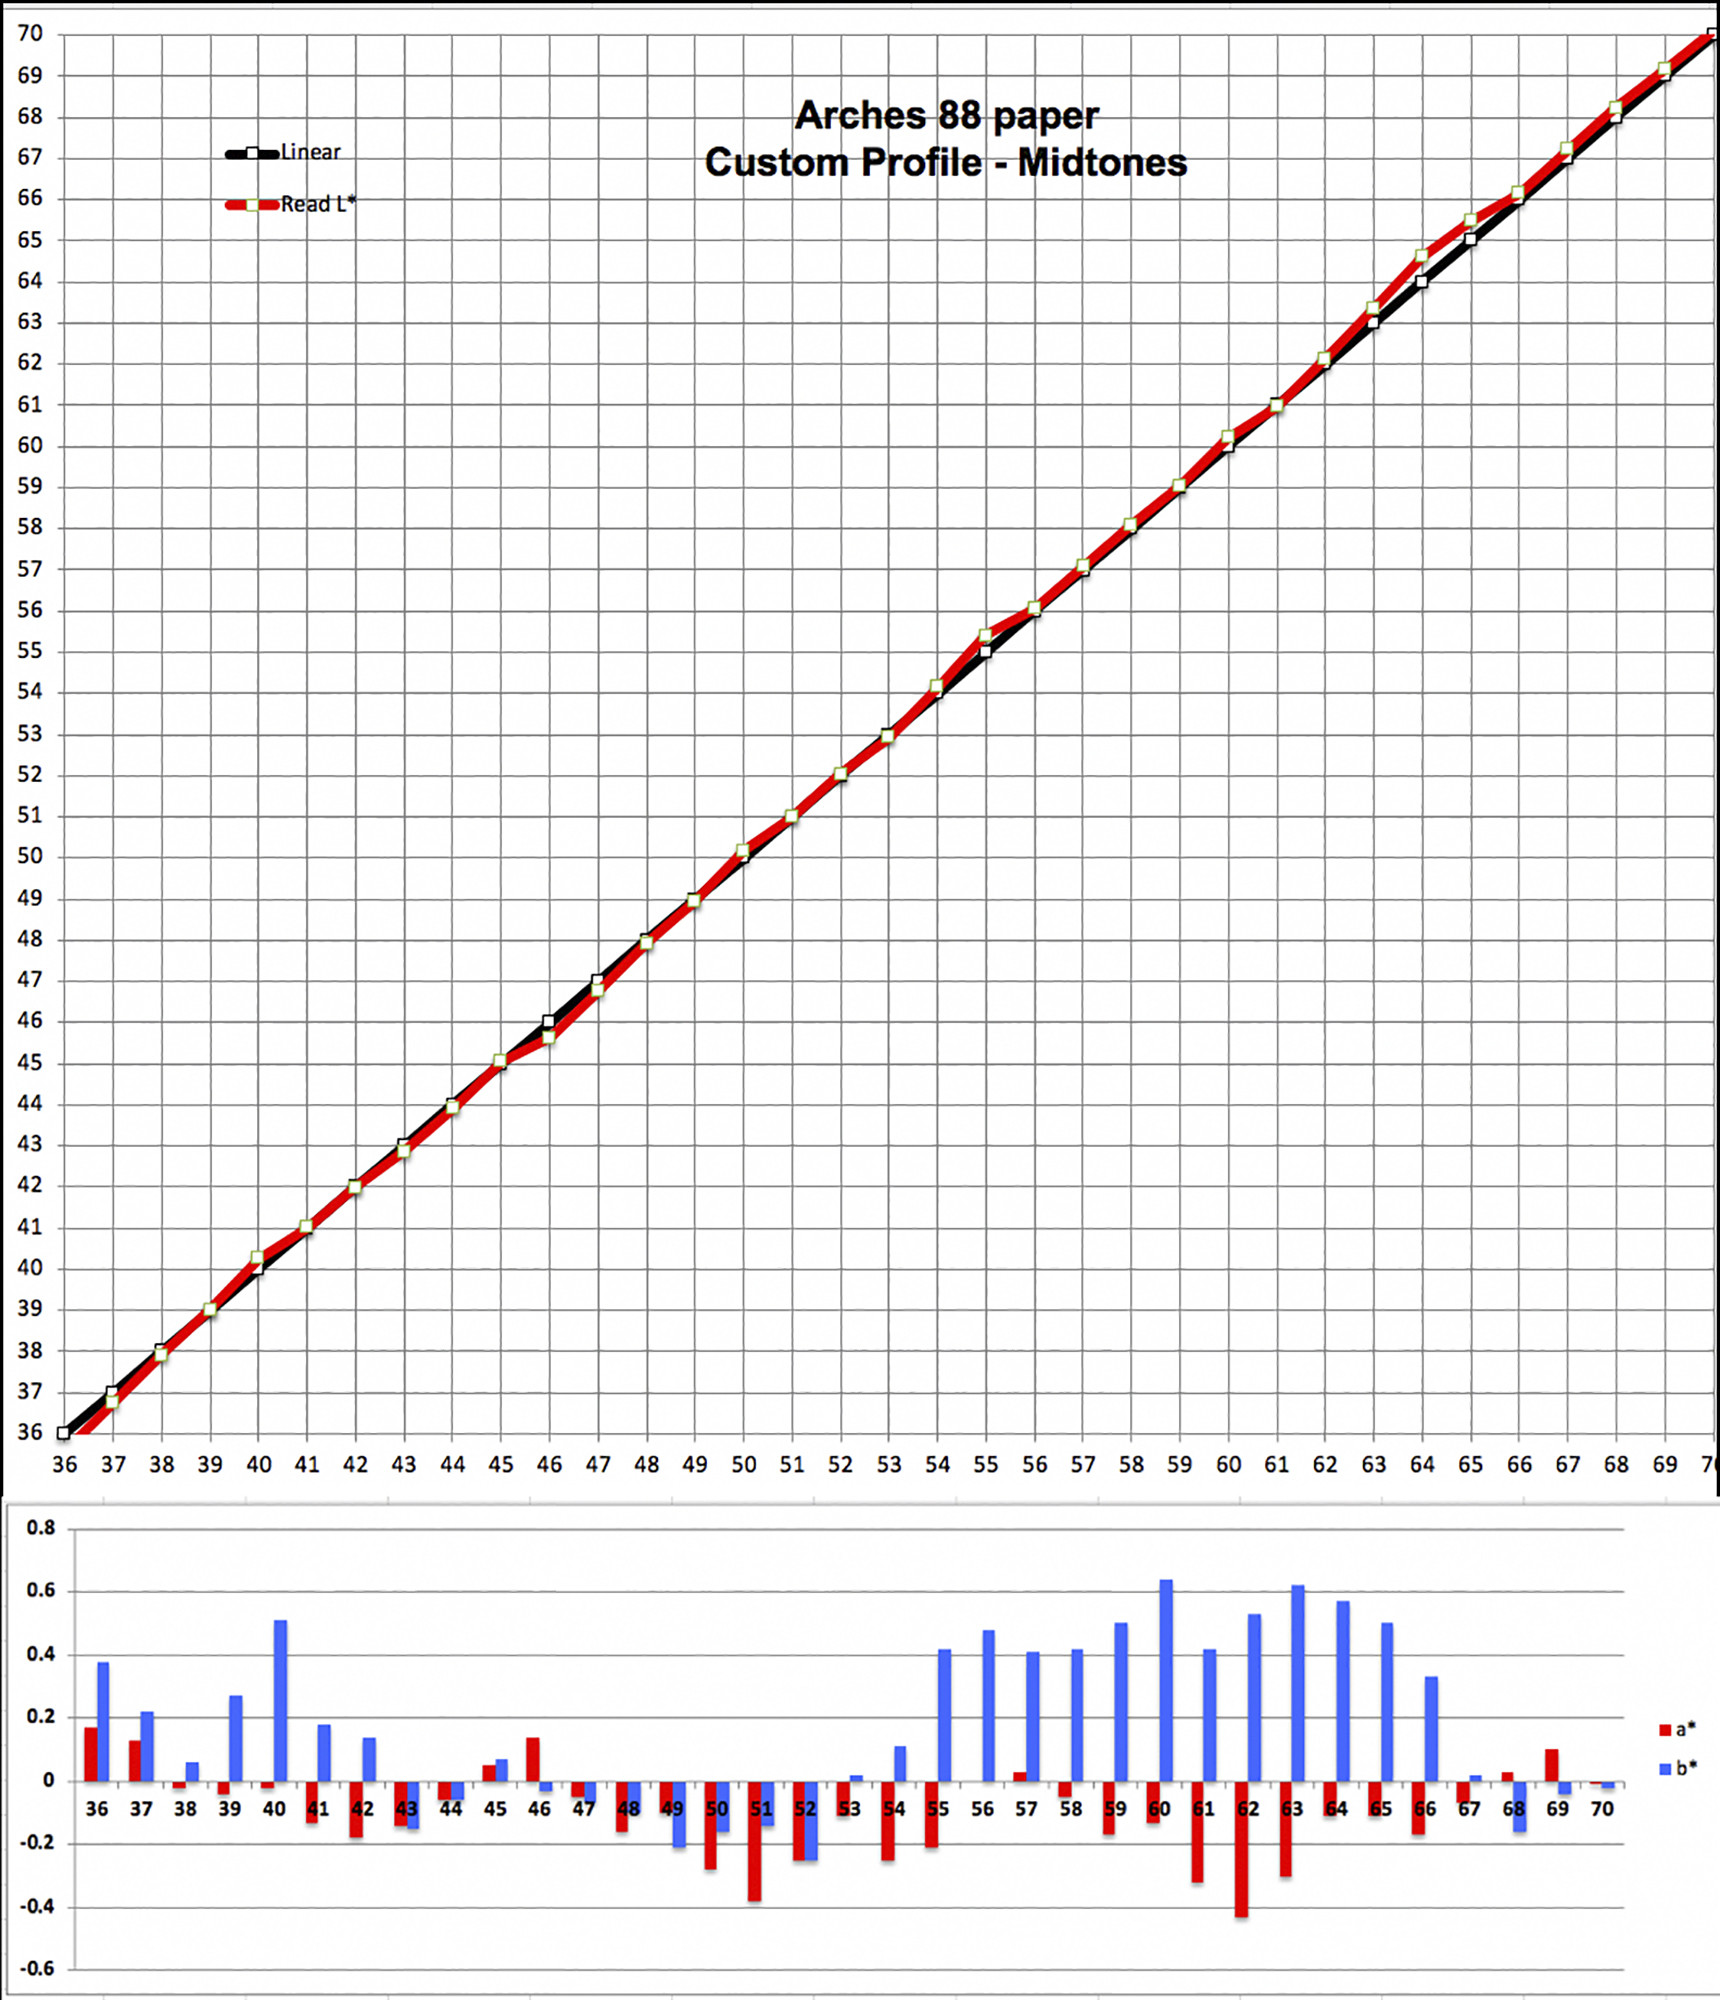
A fuller appreciation of these results is had from the graphing of the detailed data summarized in Figure 11, which I show below for Arches 88, serving as a representative example. Turning to Figure 12, for Luminance measurements (upper section), the black line shows the target reference values and the red line the measured values from the prints; the closer they converge the more accurate the printed rendition. I recall, here as in Figures 7 and 8, red values above the black line are brighter than reference values, and below the black line darker.
For hue bias, the red bars show a* and the blue bars b* departures from zero respectively. The closer the bars to 0 (vertical axis) the more neutral the hue. Values above zero are warm and below zero cool. For brevity, I show these graphs only for Arches 88 because the pictures of the outcomes are similar for the four papers.
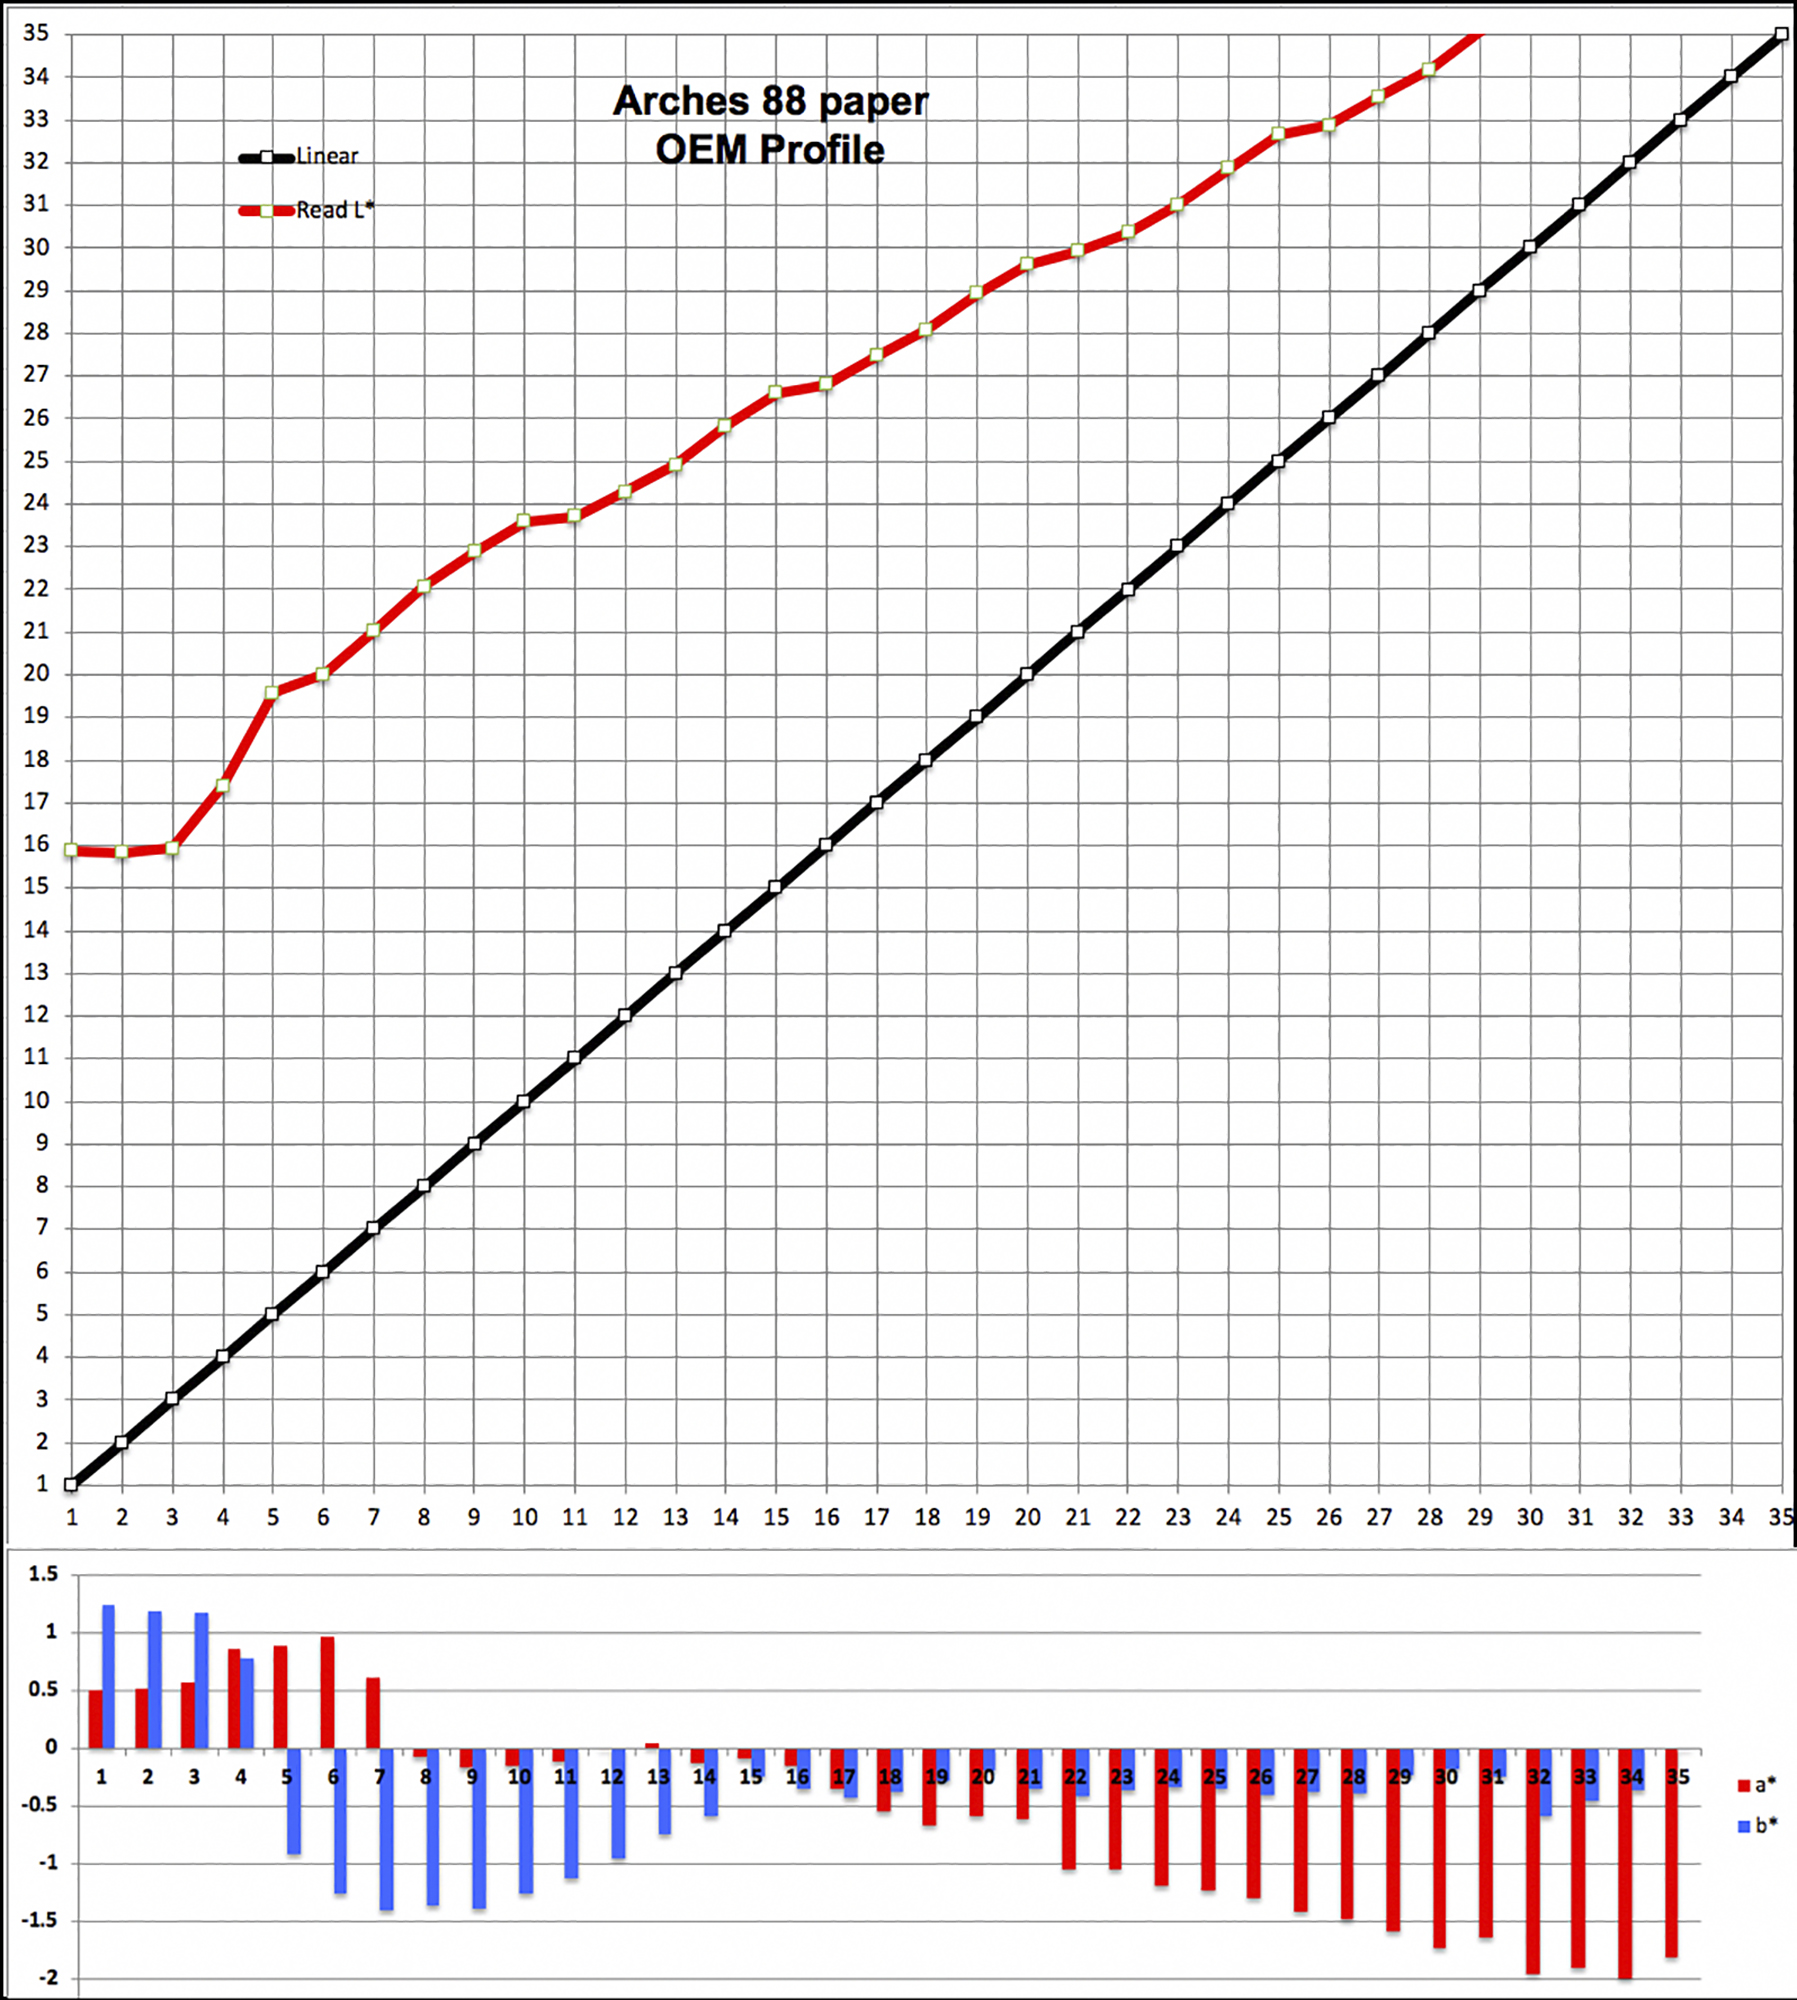
A few words about Rendering Intent (RI) are necessary to understand this grayscale portrayal. The red lines and the blue and red bars are generated from targets printed using Absolute Colorimetric RI (ABSCOL for short) in Figures 12 and 13. This RI is mainly useful for testing purposes because it does not remap the white and black points between source and output profiles. As such, it provides a relatively “pure” view of how accurately the printing system reproduces on paper the image file values sent to it, without any intermediate “tinkering”.
For M0/M1/M2 profiles, we know from Figure 1 that this paper cannot reproduce Black tones deeper than about L*16. This shows looking at the red line (read values) in Figure 12, where the outcomes are all about L*16 until that step is reached on the horizontal axis. Beyond that, the read values correspond rather tightly with the target reference values, as shown from the near convergence of the red and black lines upward of L*16. That mirrors how the average difference between read and file values beyond L*16 (Figure 1) is so low.
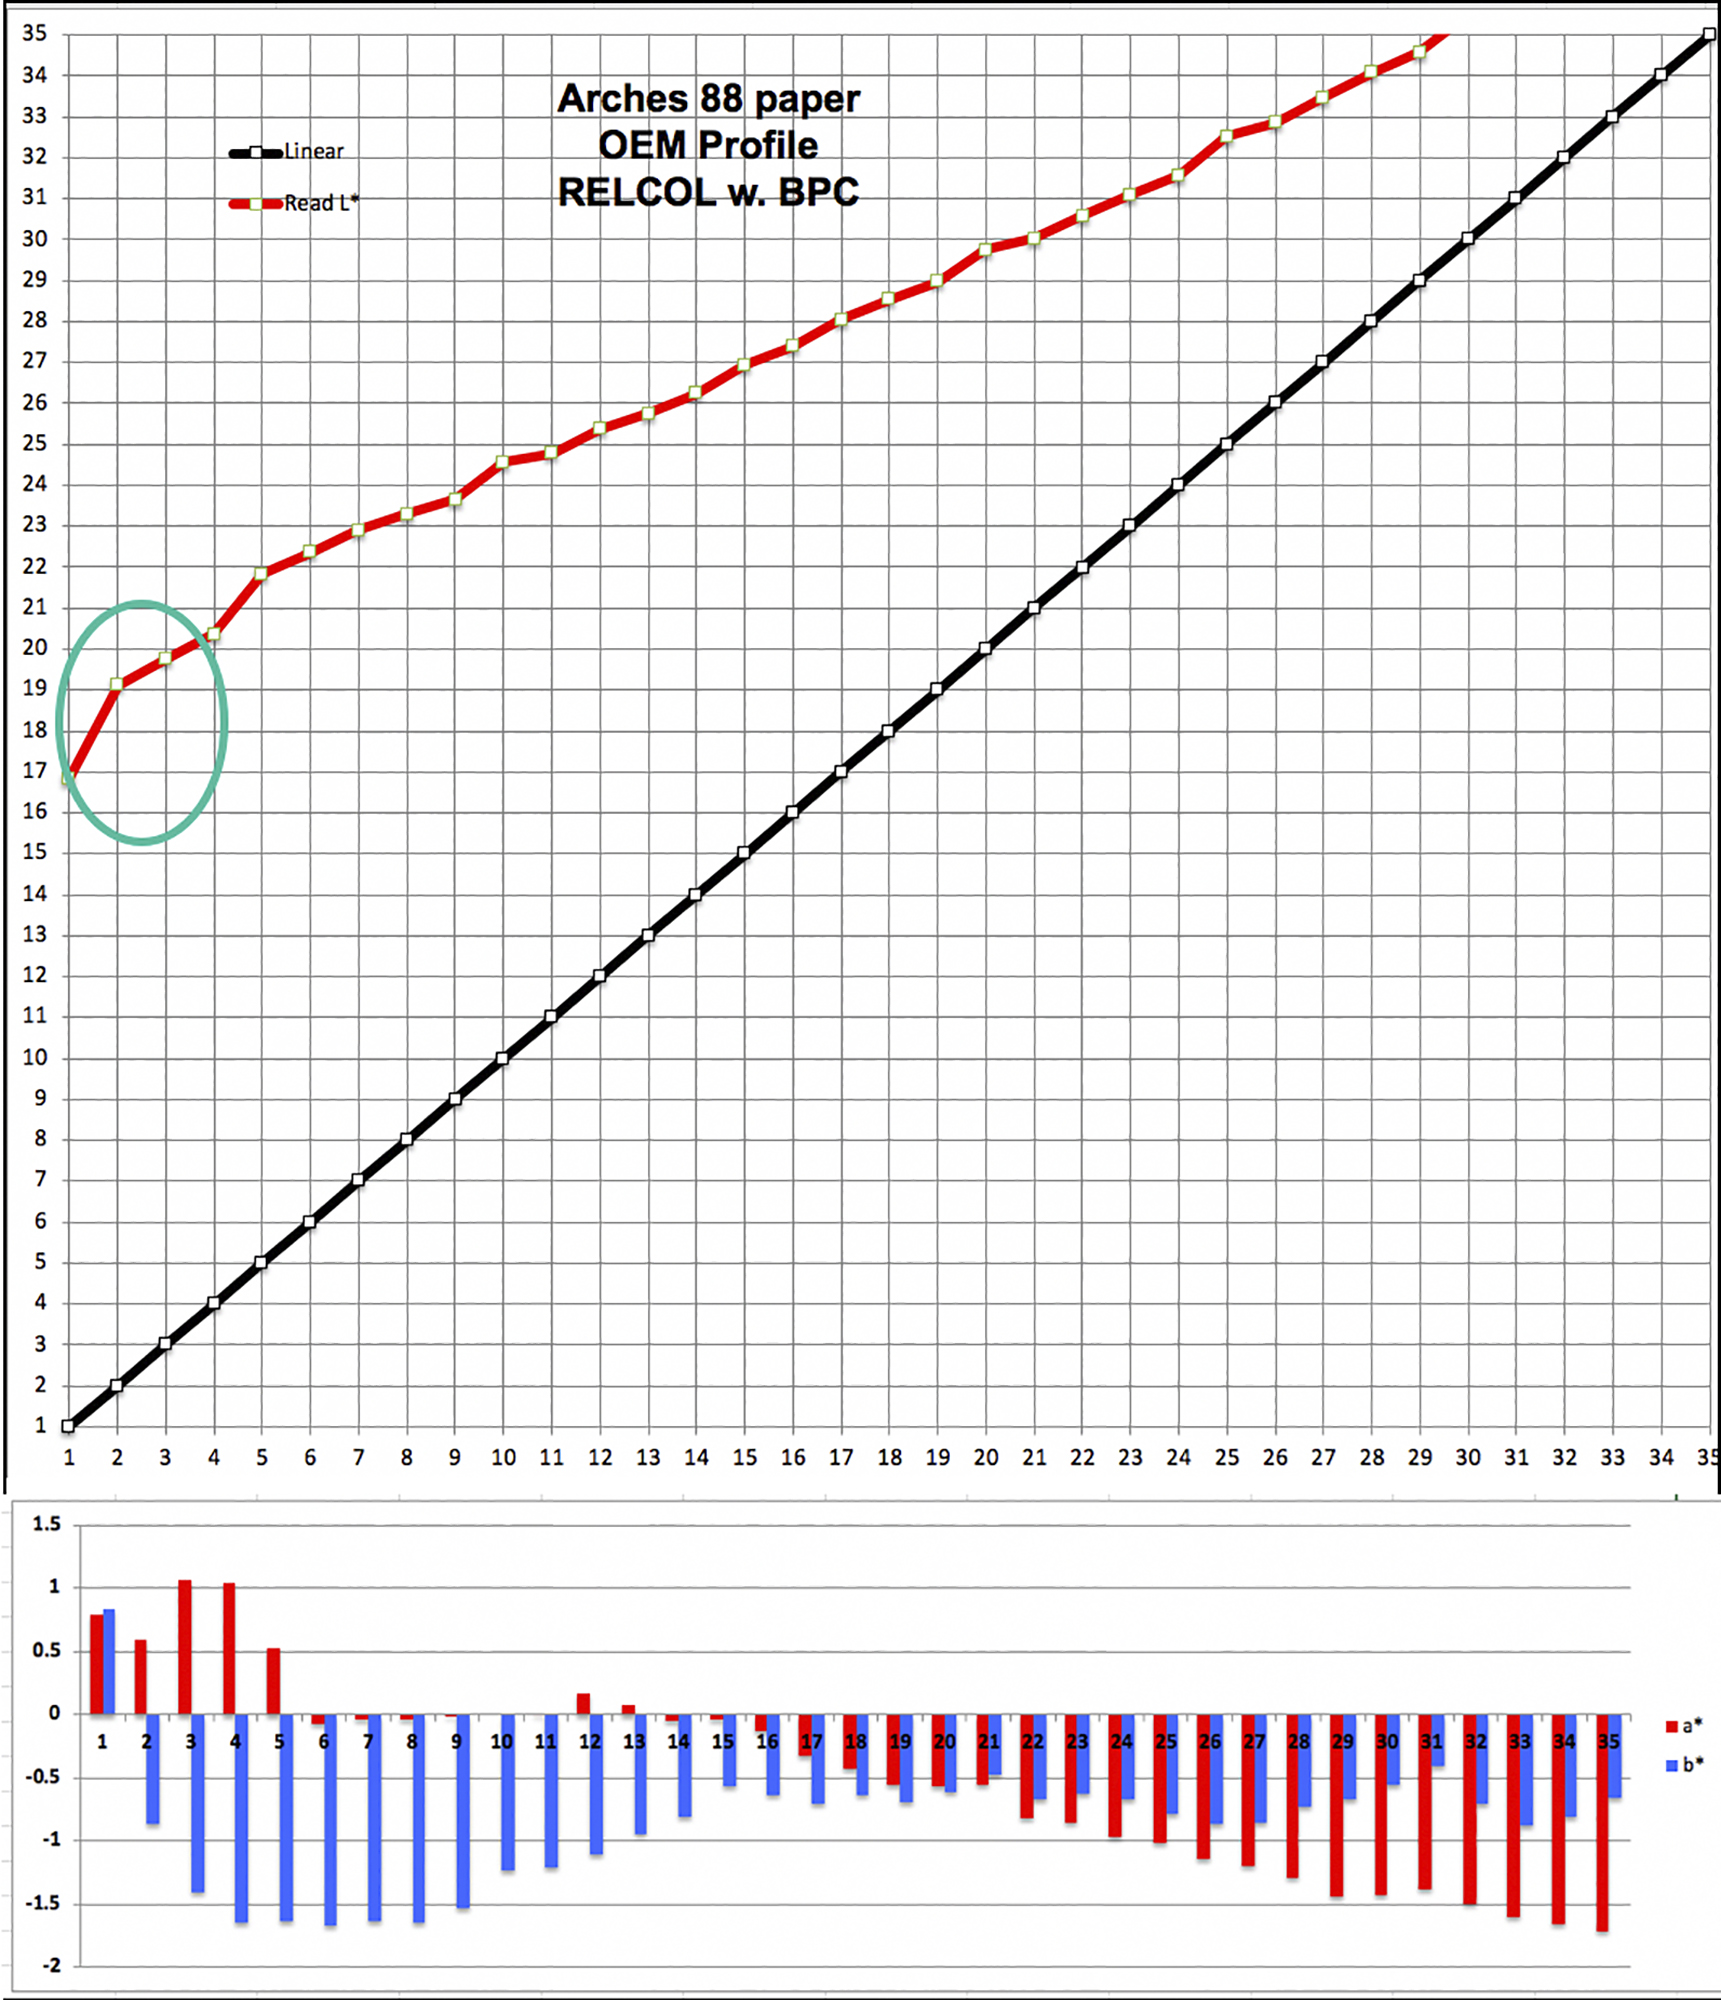
For the same exercise using the OEM M3 profile instead of the Custom M1 profile, the story changes when reading the results from the M3 profile in M1 measurement mode (Figure 13). Here there is never a convergence between the red and black values, the red (read) ones remaining quite linear but persistently above the reference values throughout. When we compare prints made with M3 versus M1 profiles, if you see a somewhat better dark tone separation with the former, this graph shows how – the bottom end of the tone scale is brighter and the values moving up the scale are more separated.
Now, as an interesting aside, like I did for the 48 patch test of Figure 8a, I wanted to see how the M3 profile reproduces the Neutral Dark tones (L*`-L*35) when reading the results in M3 measurement condition rather than M1 (as in Figure 13). Once again Legion Paper obliged by performing this measurement with their M3-enabled spectrophotometer, the result showing in Figure 13a.
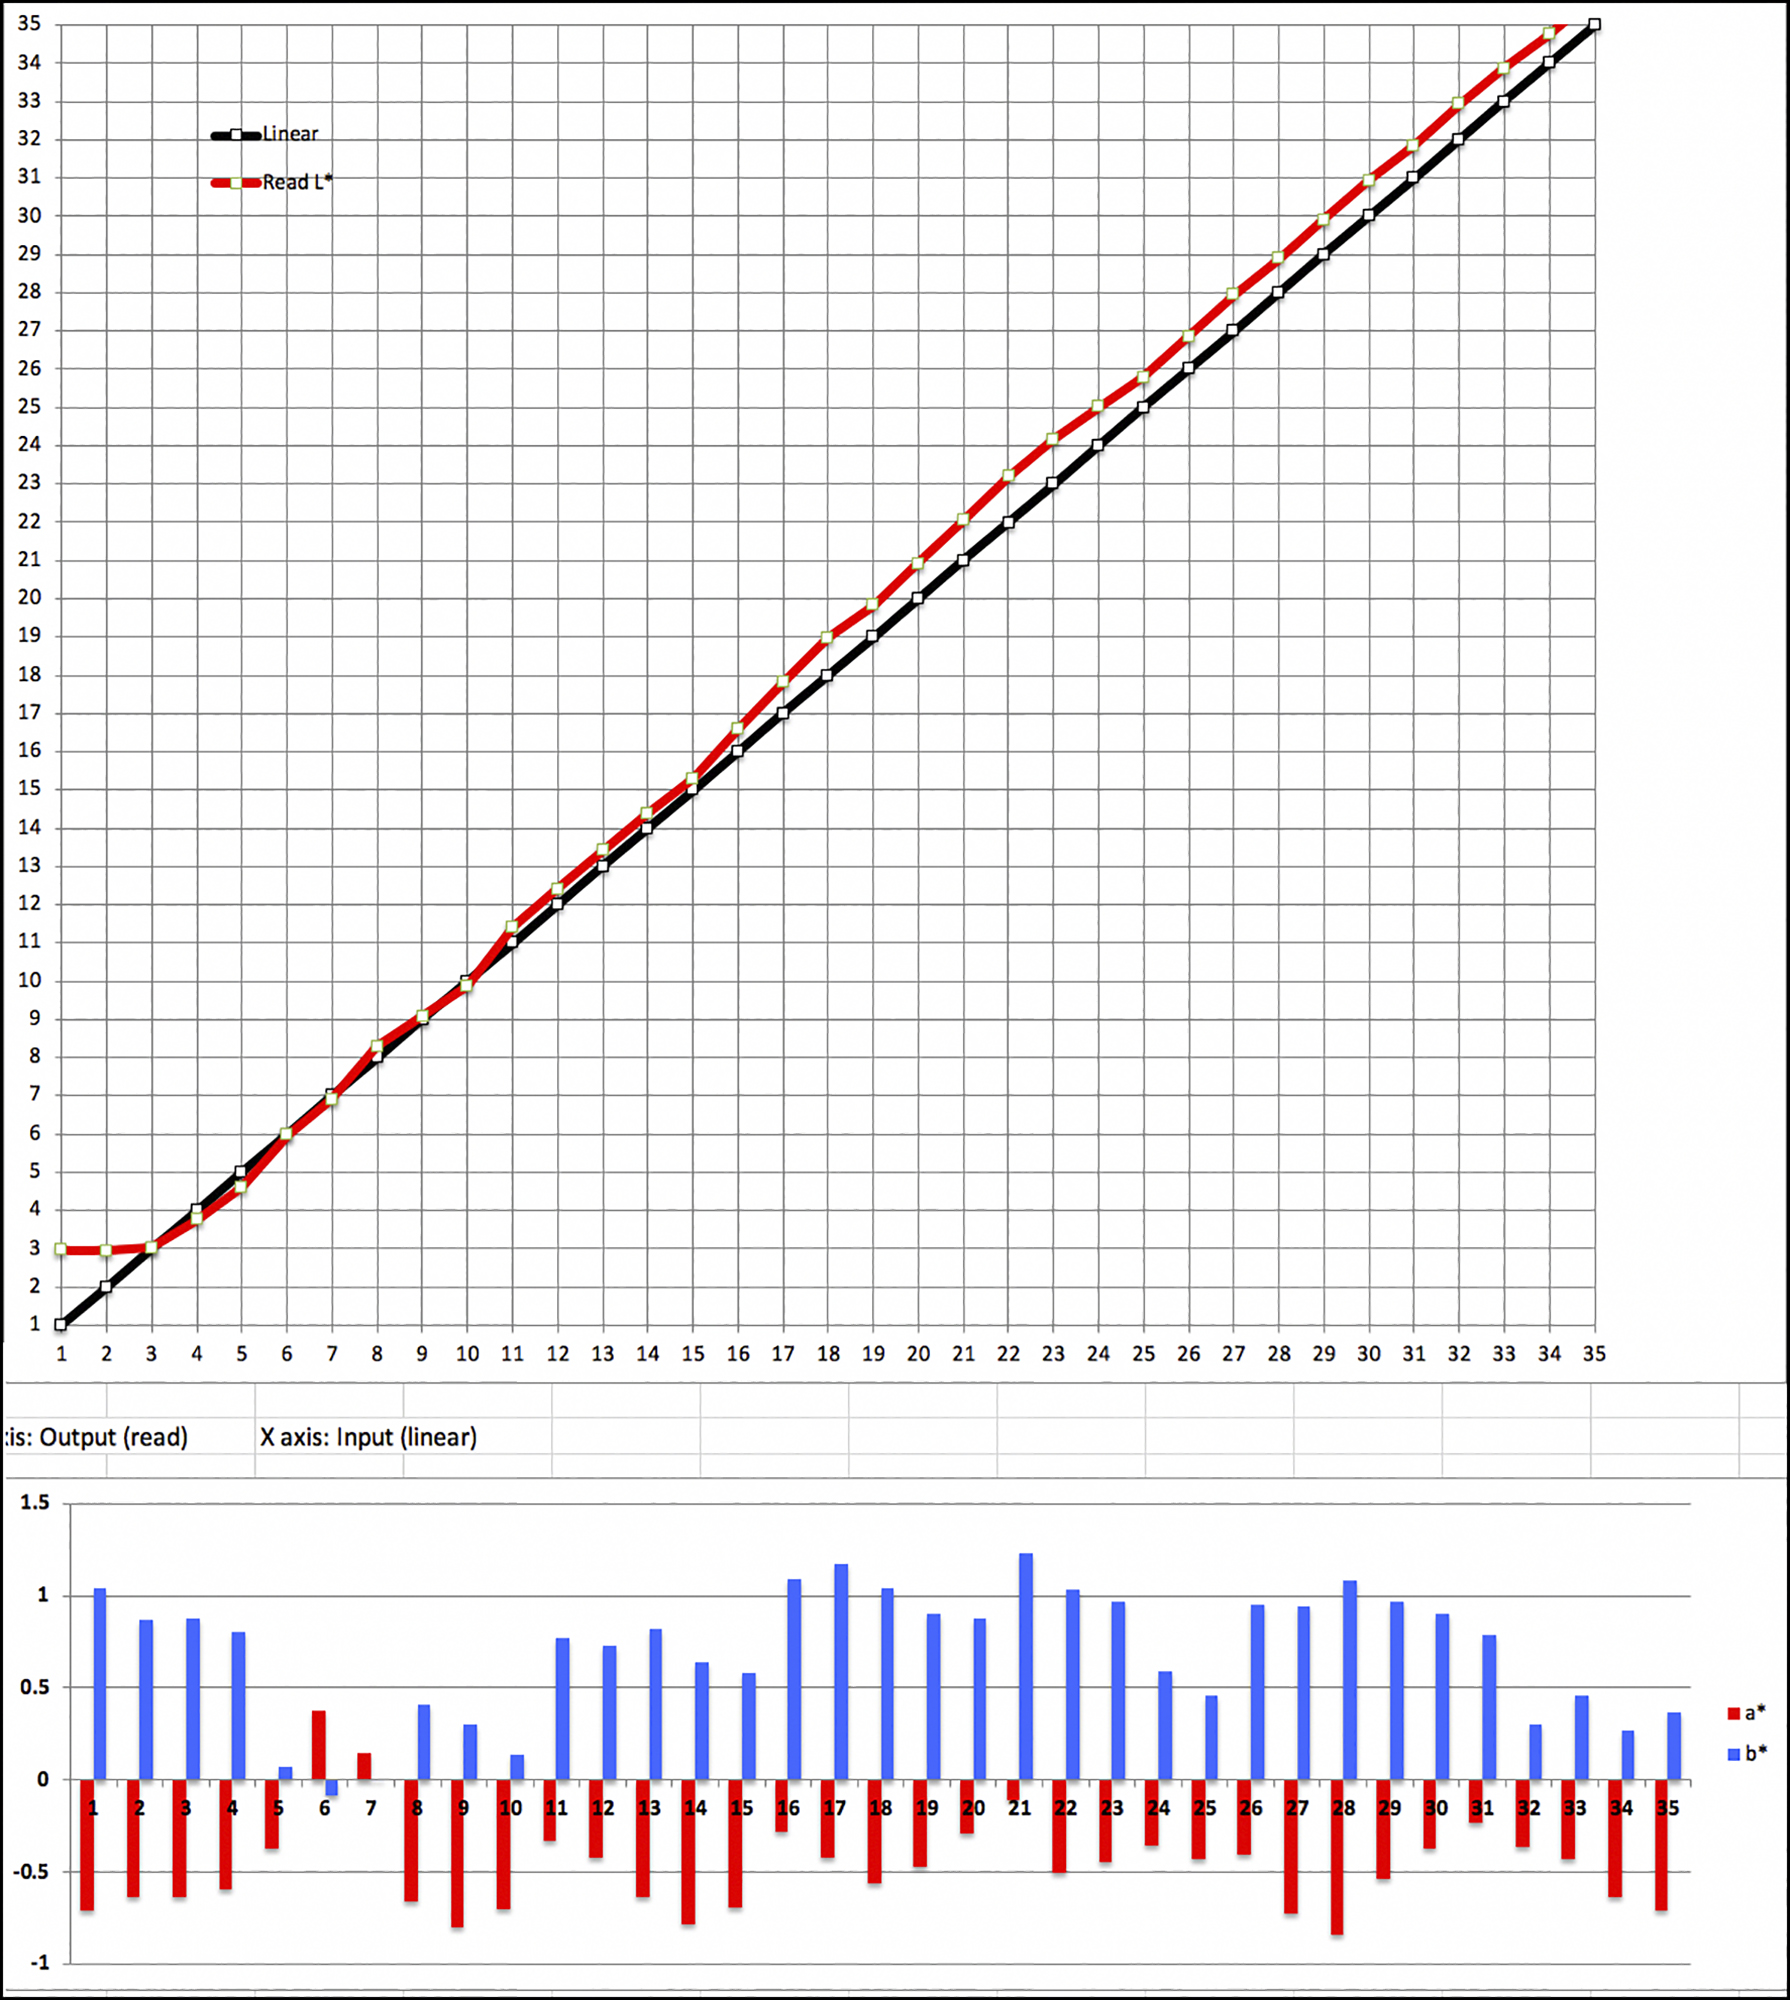
Figure 13a demonstrates once again that when an M3 profile is evaluated with a device enabling an M3 measurement condition, the Black Point in the results resembles that measured in ColorThink Pro for the profile; as well, the read values from the print correspond closely with the image reference values, indicating that within an M3 “round-trip” between profiling and testing, M3 profiling is good and works well with this paper. However, I revert to the M1 measurement environment as this is the more usual print viewing condition.
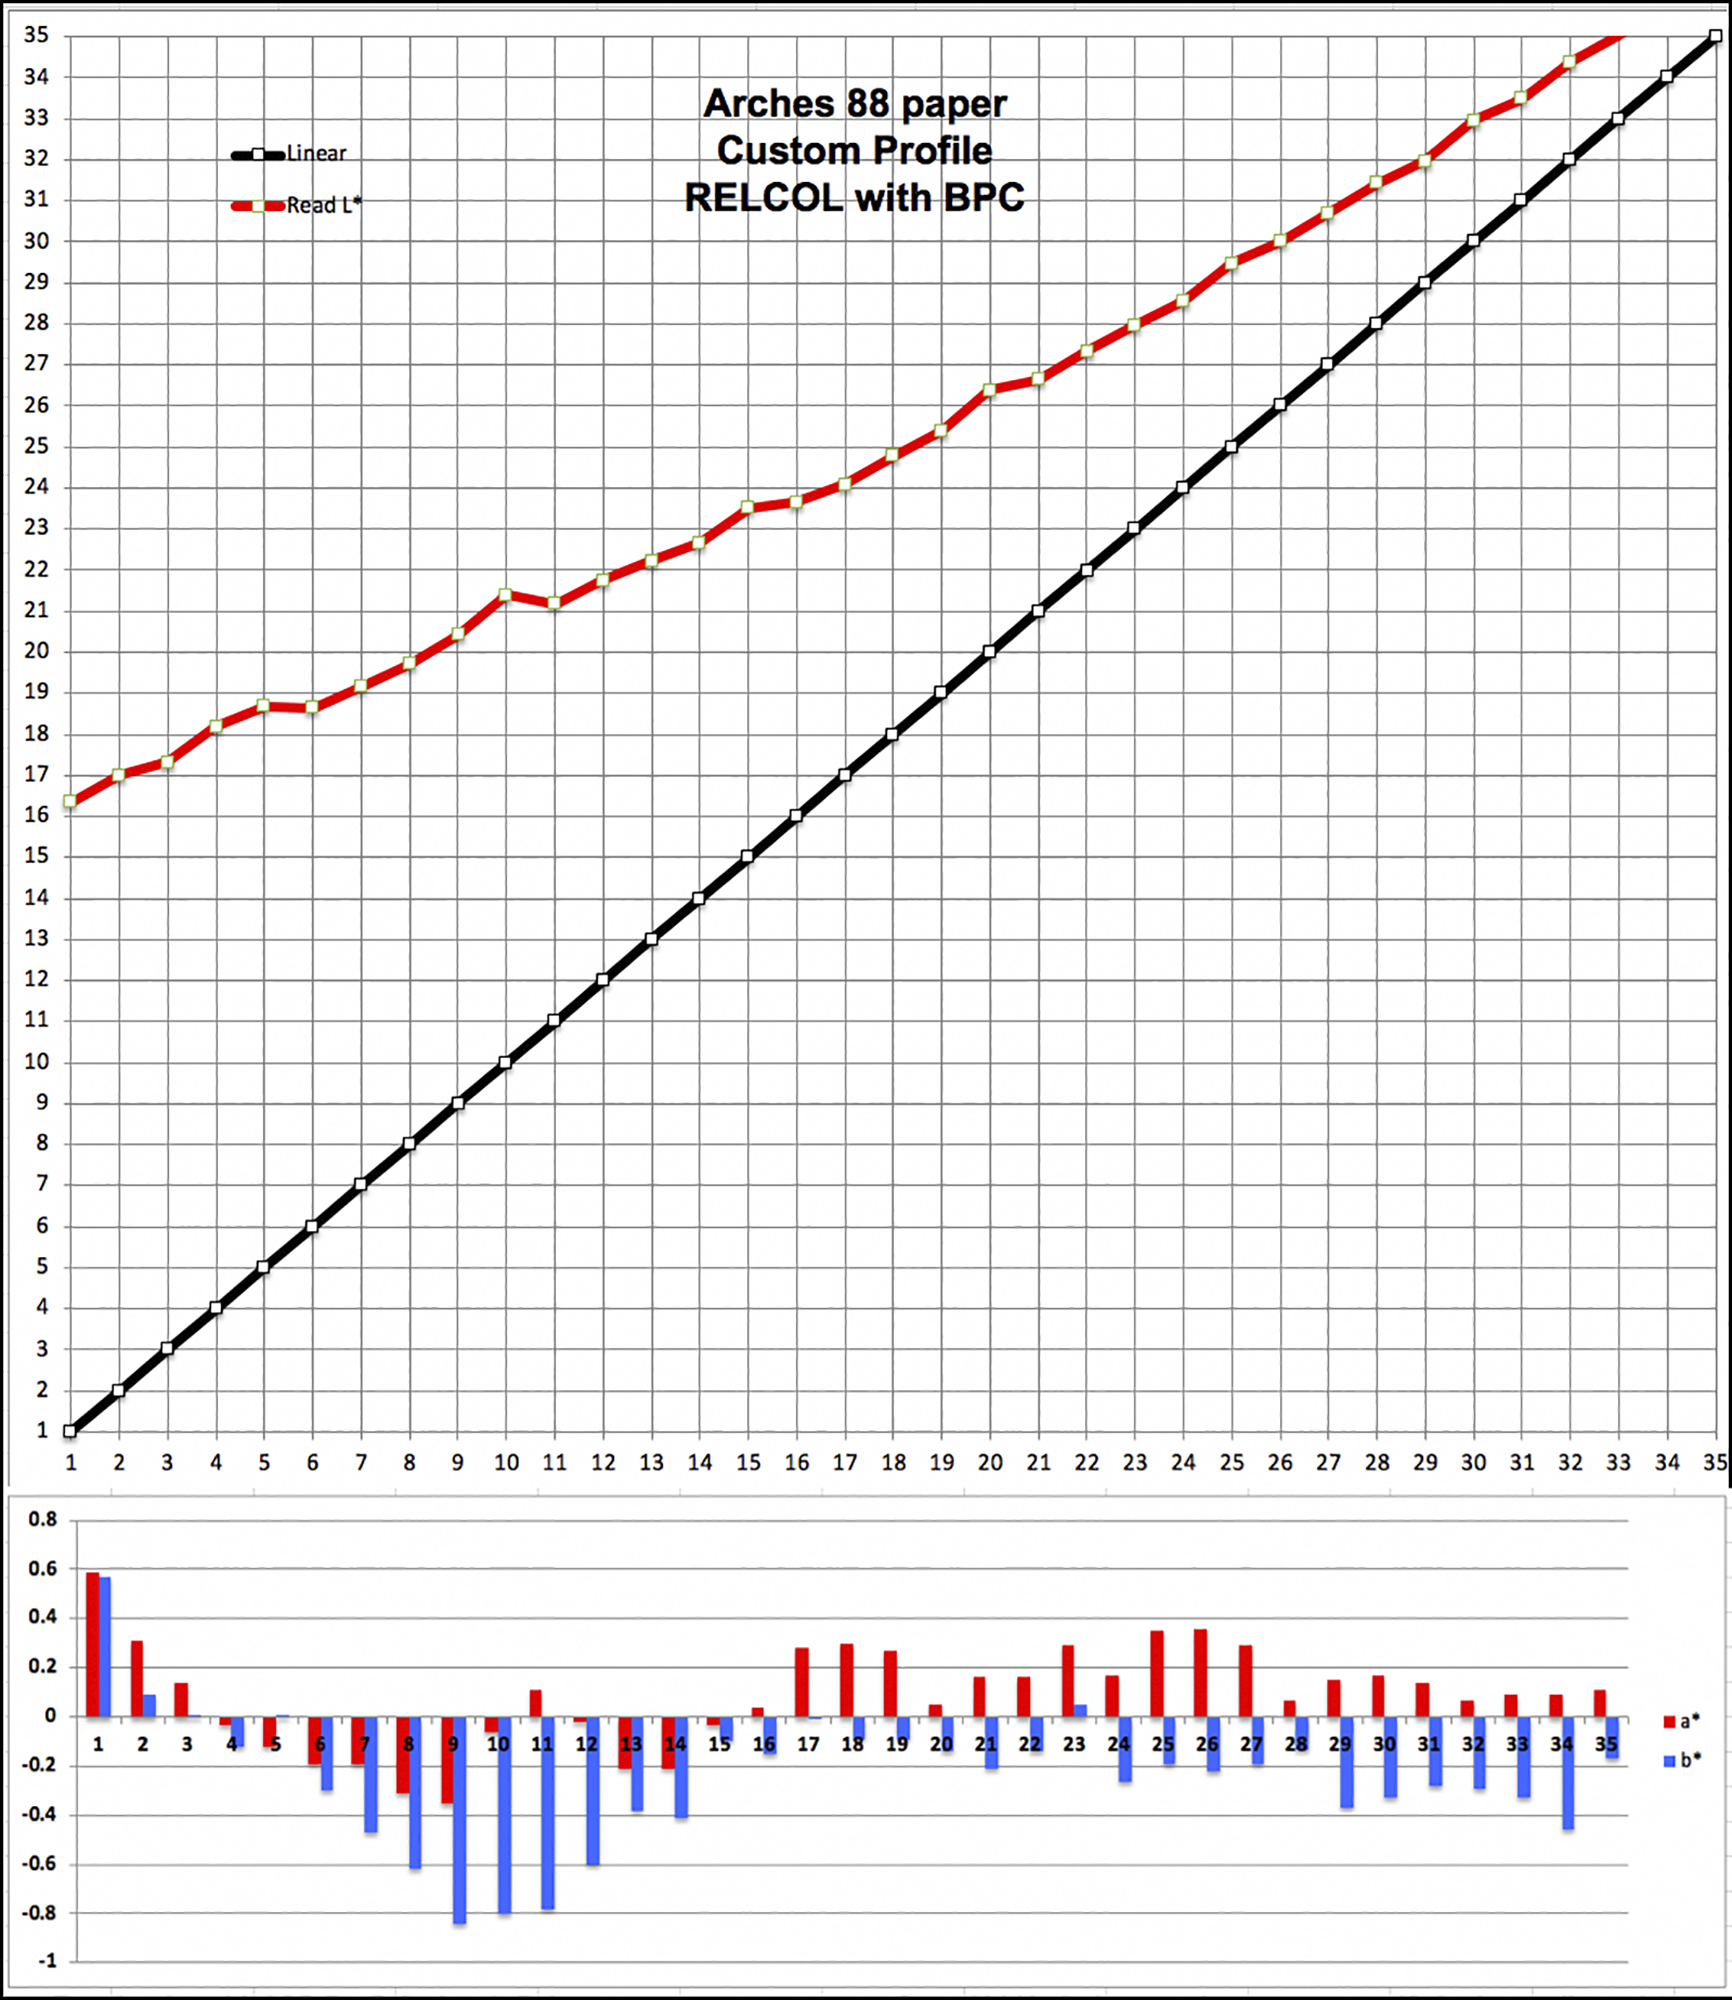
Reverting to the Figure 13 graph, where I read an M3 profile with an M1 measurement condition, it resembles the outcomes when printing this target with an M1 profile in Relative Colorimetric (RELCOL) RI and Black Point Compensation (BPC) (Figures 14, 15), as one would do in regular photographic printing of real photographs.
Notice the broad similarity in the shapes of the Luminance results between Figures 13, 14 and 15 compared with those of Figure 12. What does all this mean?
If you made a print in ABSCOL with an M1 profile (Figure 12 conditions), the first 16 levels in the image file would be compressed into an indistinguishable mass (or mess) because there would be no separation of brightness levels (hence no contrast) between them. However, for Figures 13, 14 and 15 conditions, the curve shows the very darkest image file tone remapped to about L*16L*17, and then all other values remap correspondingly upward from L*16/17, indicating separation of every tonal level, hence visible distinction of shadow detail starting from as Black as the printing system can reproduce.
Because we normally print using, say, RELCOL with BPC (or Perceptual RI), these RI conditions overwhelm the difference between M1 and M3 profiling to a very considerable extent, except in the very deepest dark tones – see Figure 15, (M3 profile), green oval, where the relatively steeper curve shows the contrast is more accentuated over the several darkest levels, compared with the same area in Figure 14 for the M1 profile. This explains why you will see that the main observable differences in prints from M3 versus M1 profiles are more confined to the very darkest levels and otherwise tend to be subtle, if visible at all.
At this point, you may be asking why bother with these belaboured ABSCOL plots altogether if we end-up printing in another RI which happens to largely over-ride the differences portrayed with the ABSCOL outcomes?
Fair question, and fortunately, an easy answer. Regardless of what RI we print with, we want to know whether the printing system can accurately reproduce the colours we see on the screen (assuming we are using a properly calibrated and profiled monitor). ABSCOL RI is the most accurate way we have of telling us the extent to which this will be the case because it does not remap white points between source and destination profiles. If the results from testing in ABSCOL turn out well, it means that when we select another RI (say RELCOL with BPC) which does remap tones, and we adjust our photos under softproof with the correct paper profile, the RI we want for that photo and Simulate Paper White option active, the resulting tones and colours we see on screen will be accurately reproduced on paper incorporating the RI and associated remapping we selected.
So much for grayscale Luminance of the dark tones from the target test results. Let us turn to the portrayal of hue neutrality in the dark tones. Here we see that on the whole, hue neutrality is better preserved with the custom M1 profile whether printed in ABSCOL or RELCOL However, whichever printing condition is examined, the extent of the departures from neutral gray is generally not large enough to produce the appearance of remarkable color casts in the grays. We’ll confirm this looking at prints of real photos below.
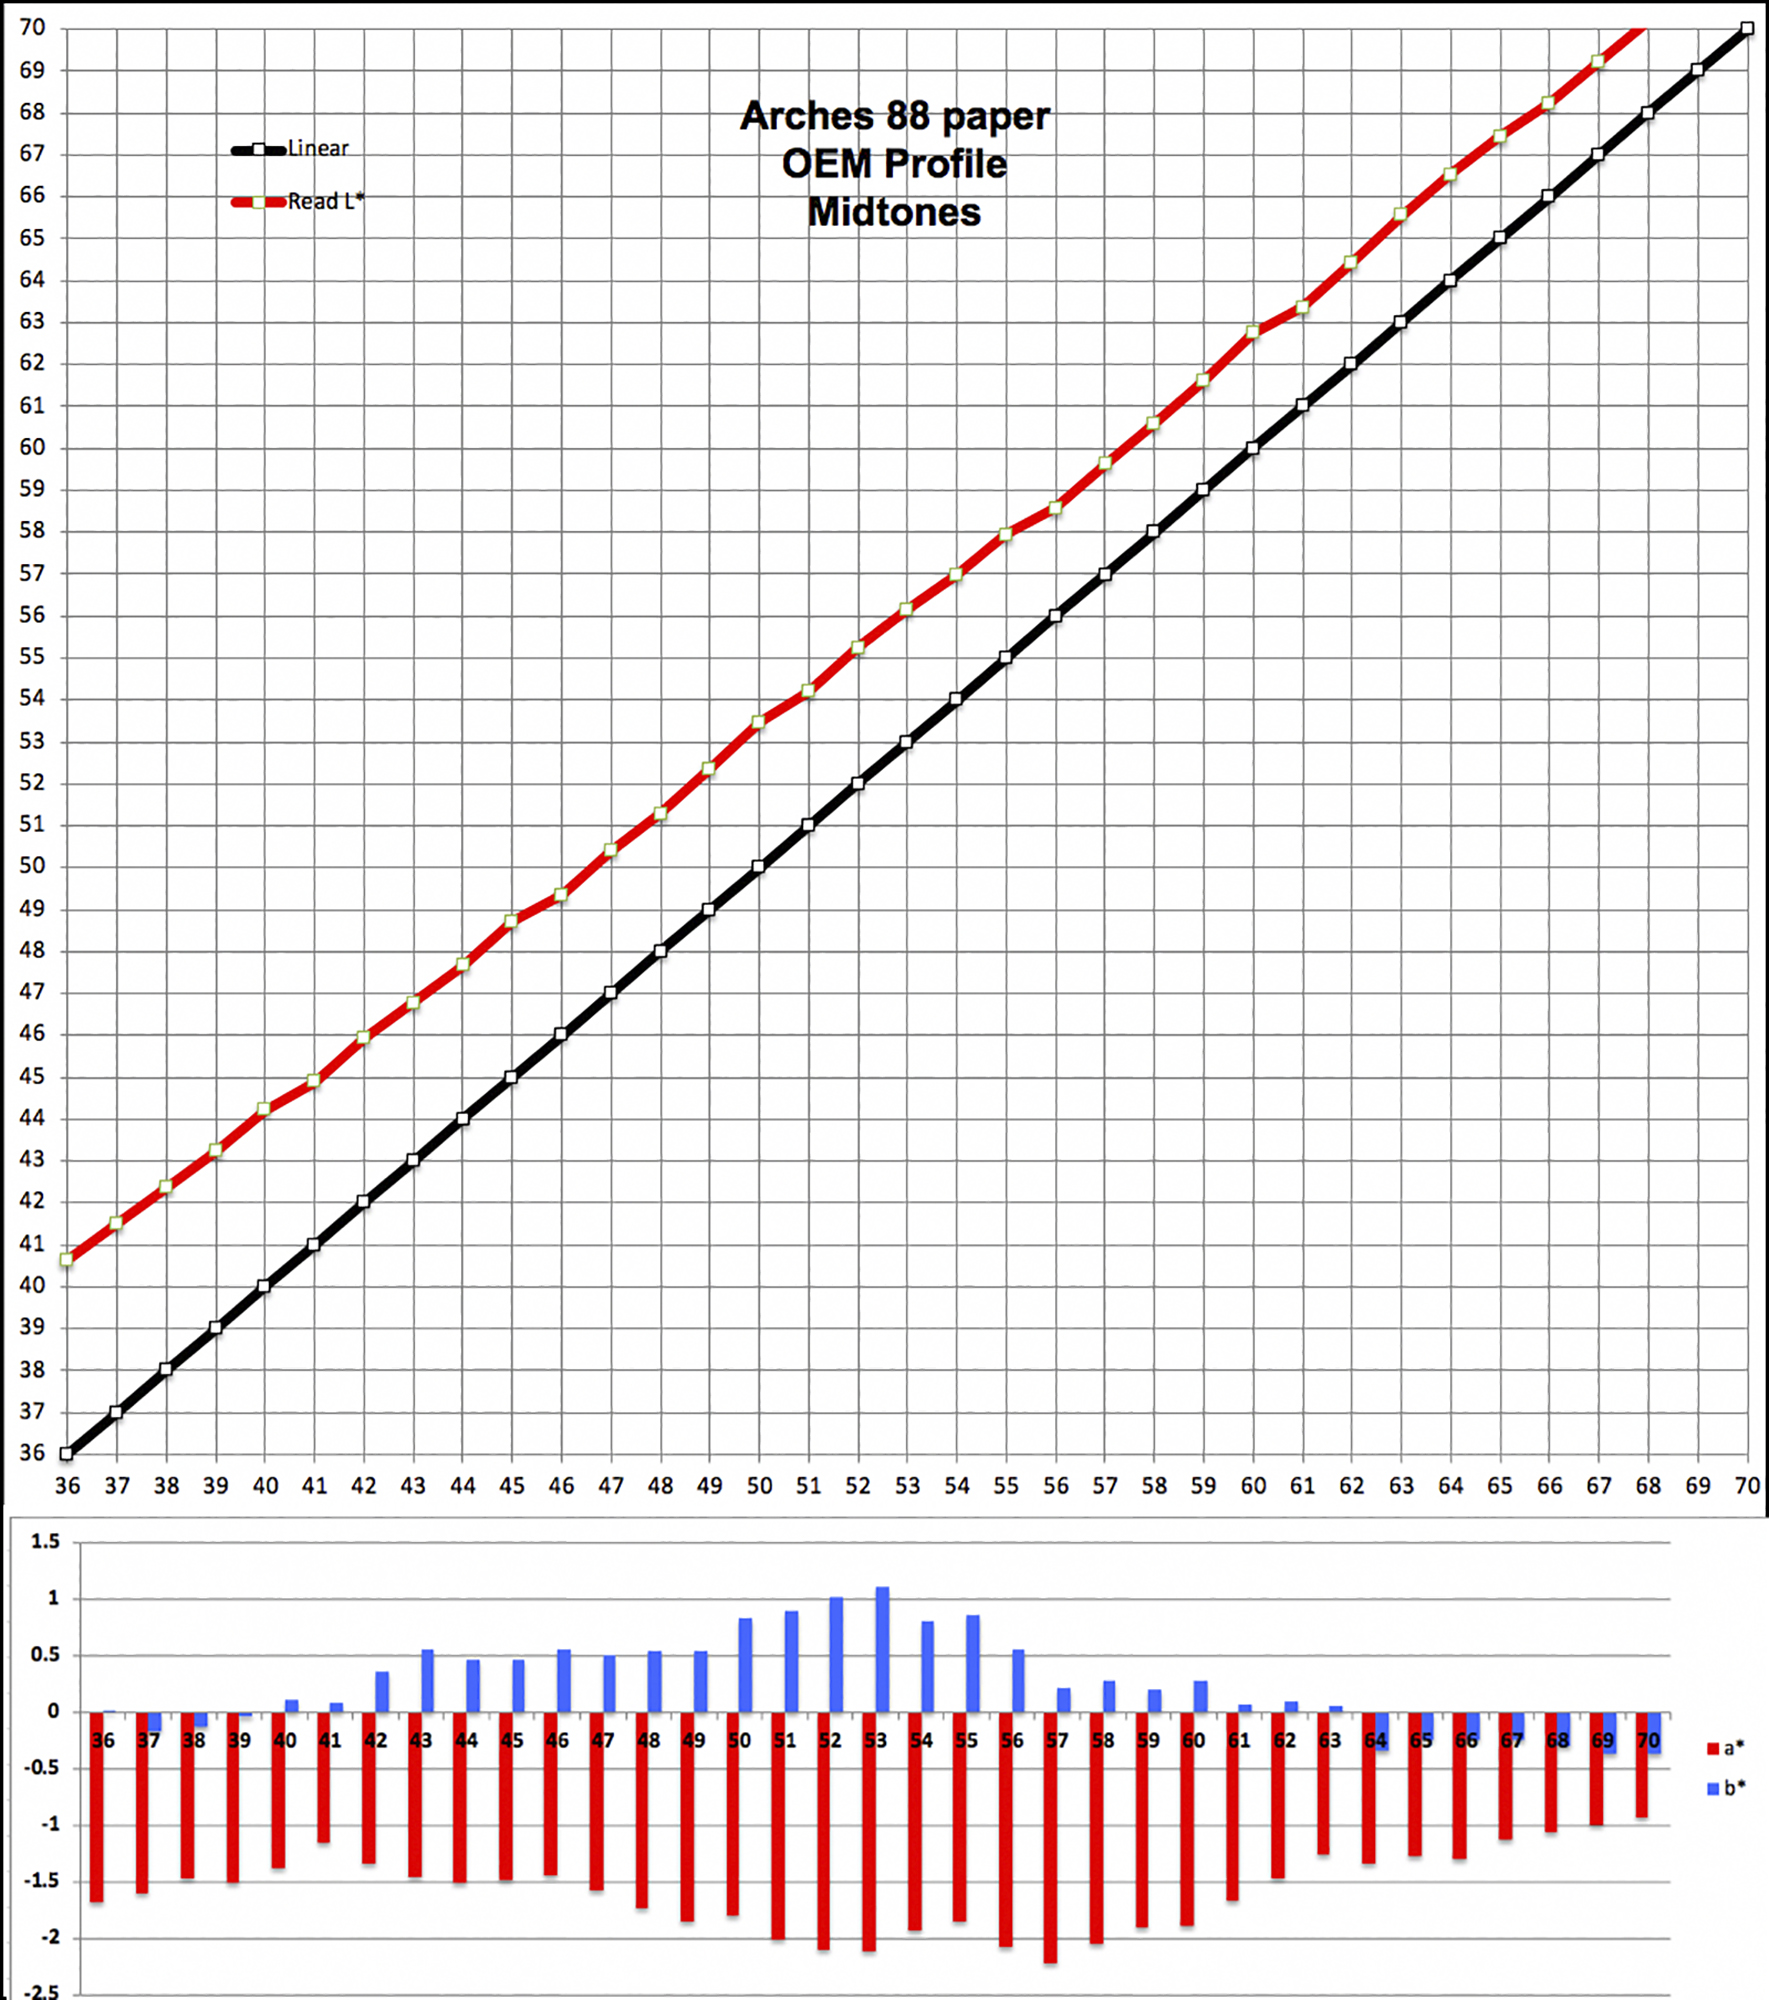
But first, I examine the mid-tones (Figures 16,17) and highlights (Figures 18,19) of the grayscale for the Custom and OEM profiles.
Looking at the mid-tone Luminance scale (Figure 16 upper for the midtones), the convergence of read values with reference values is almost perfect for the Custom profile. For the OEM profile (Figure 17), the read values remain brighter than the reference values, but the divergence gradually decreases in a linear manner as one progresses up the scale.
Hue neutrality is considerably better for the Custom profile (Figure 16, lower), it being well below +/- 1, while for the OEM profile there is a moderate cool bias that may be slightly perceptible if compared with a truly neutral gray scale.
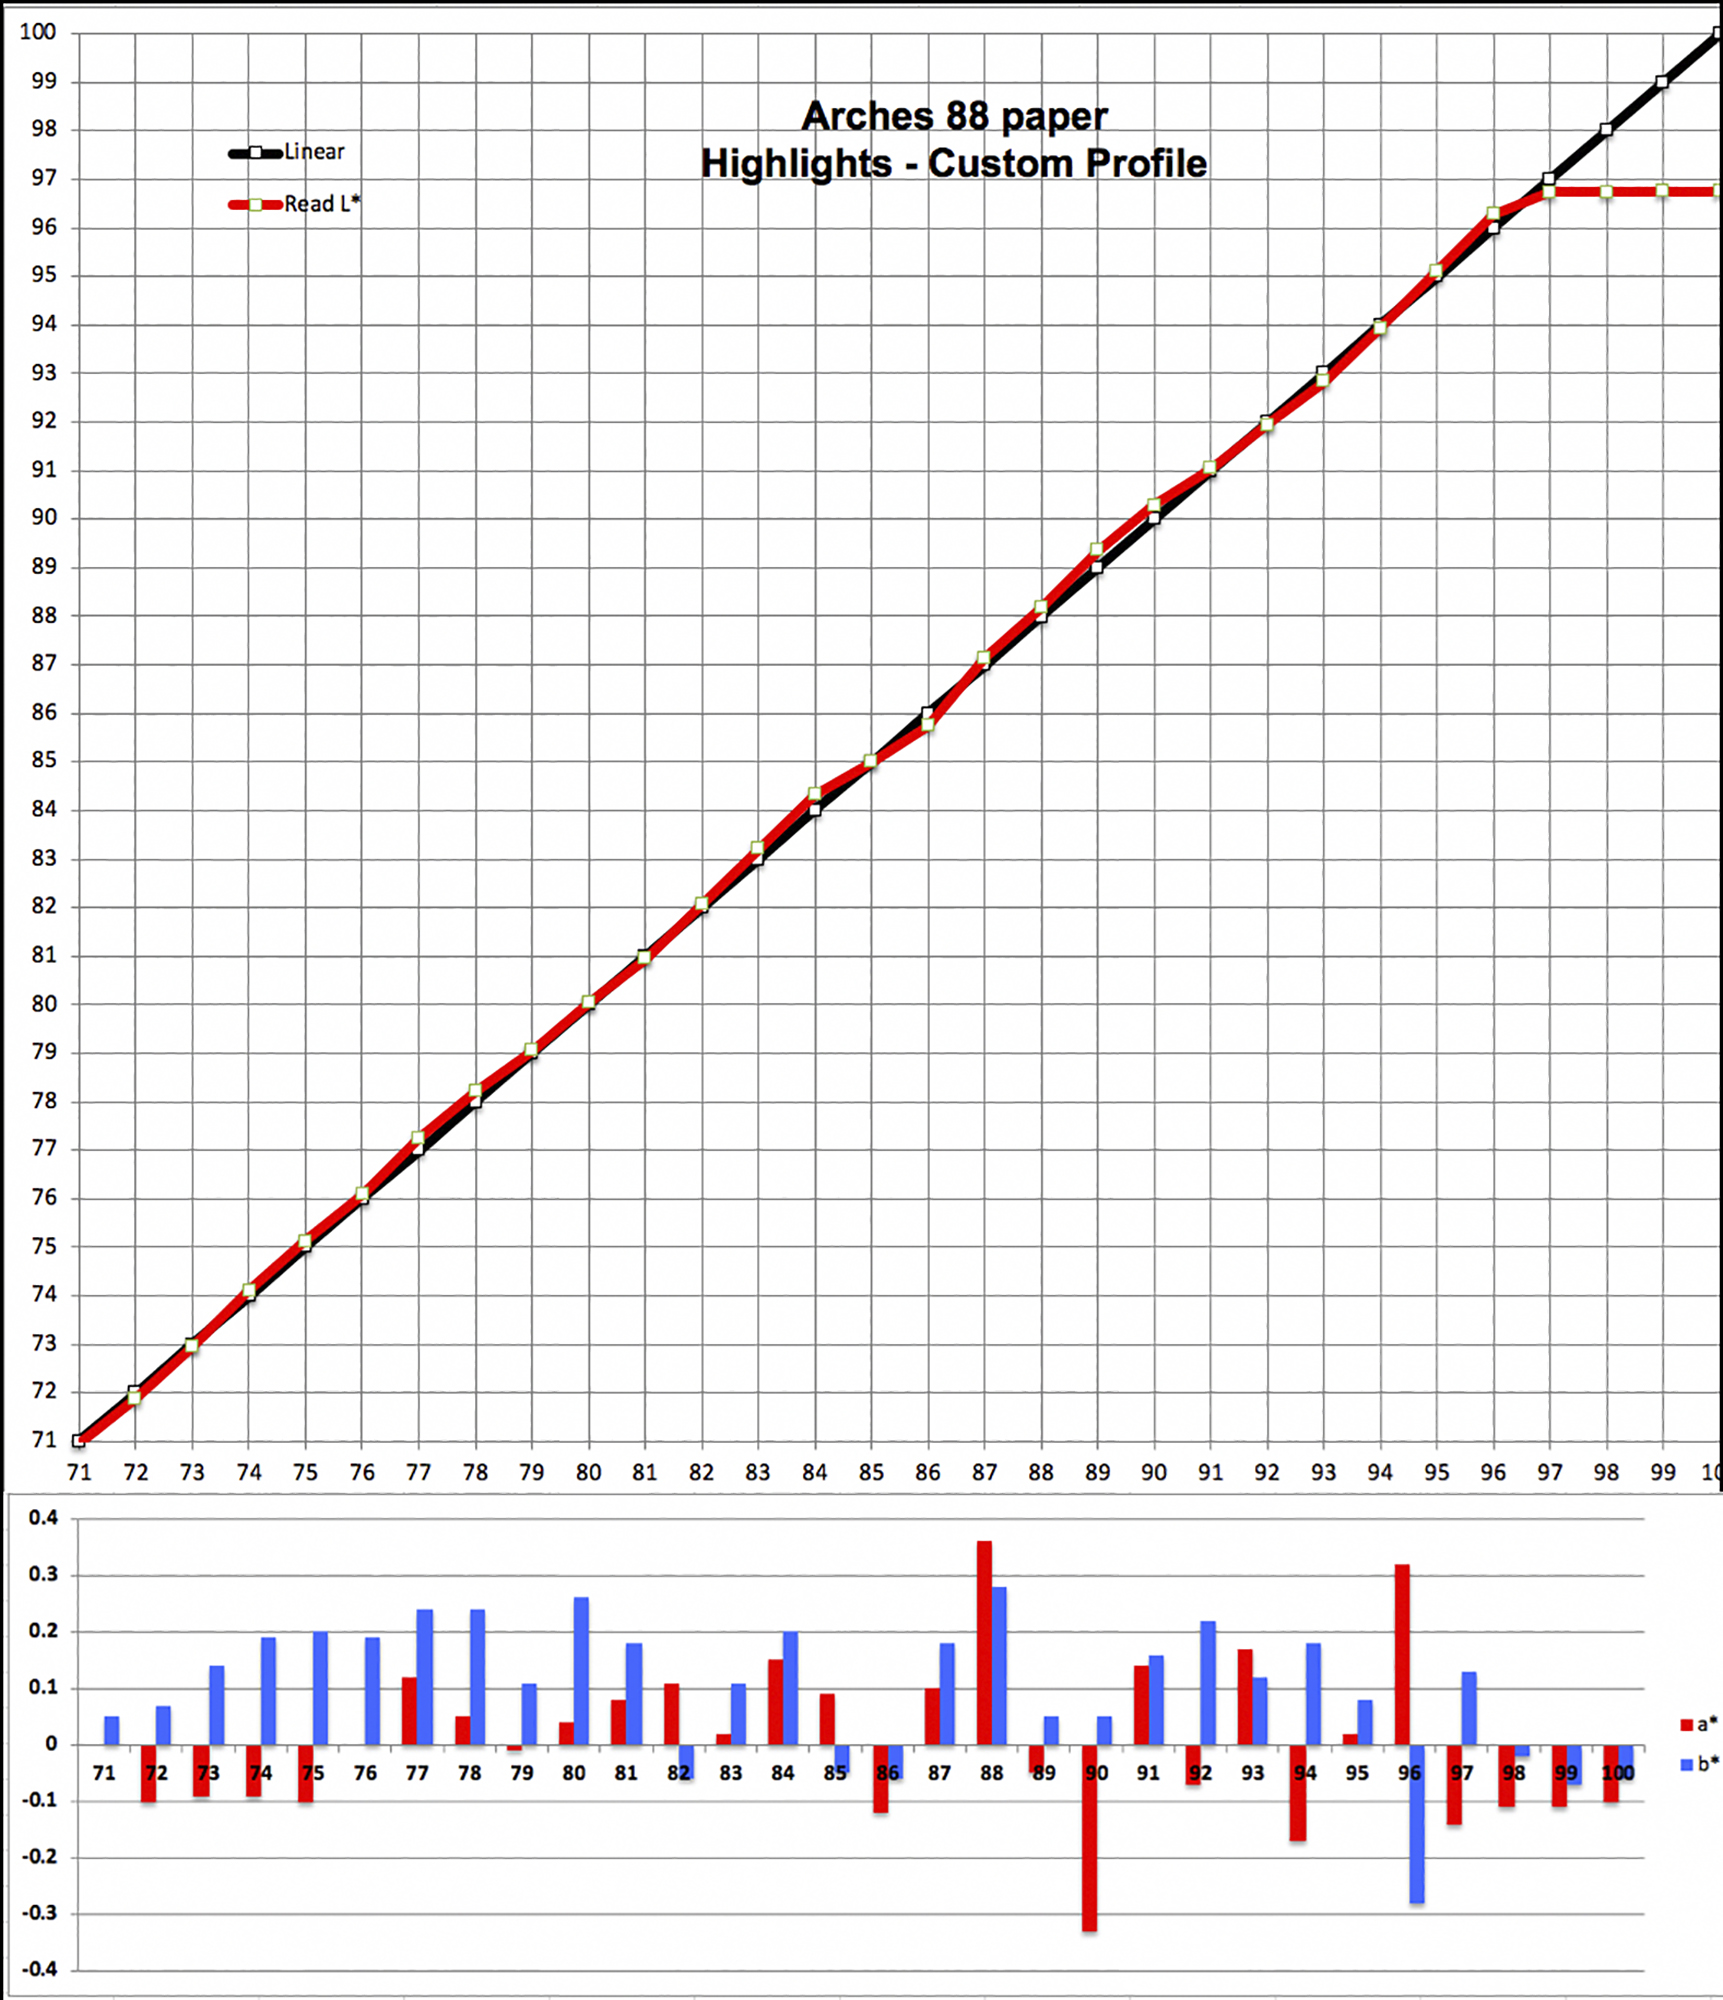
For the highlights, the Custom profile Luminance scale (Figure 18 upper), the read values just about completely converge with the target reference values until Level 97 when the whiteness limit imposed by the paper white disconnects the curves.
The values for hue bias are far below +/- 1.0 throughout, indicating there would be no perceptible hue bias in this brightness range.
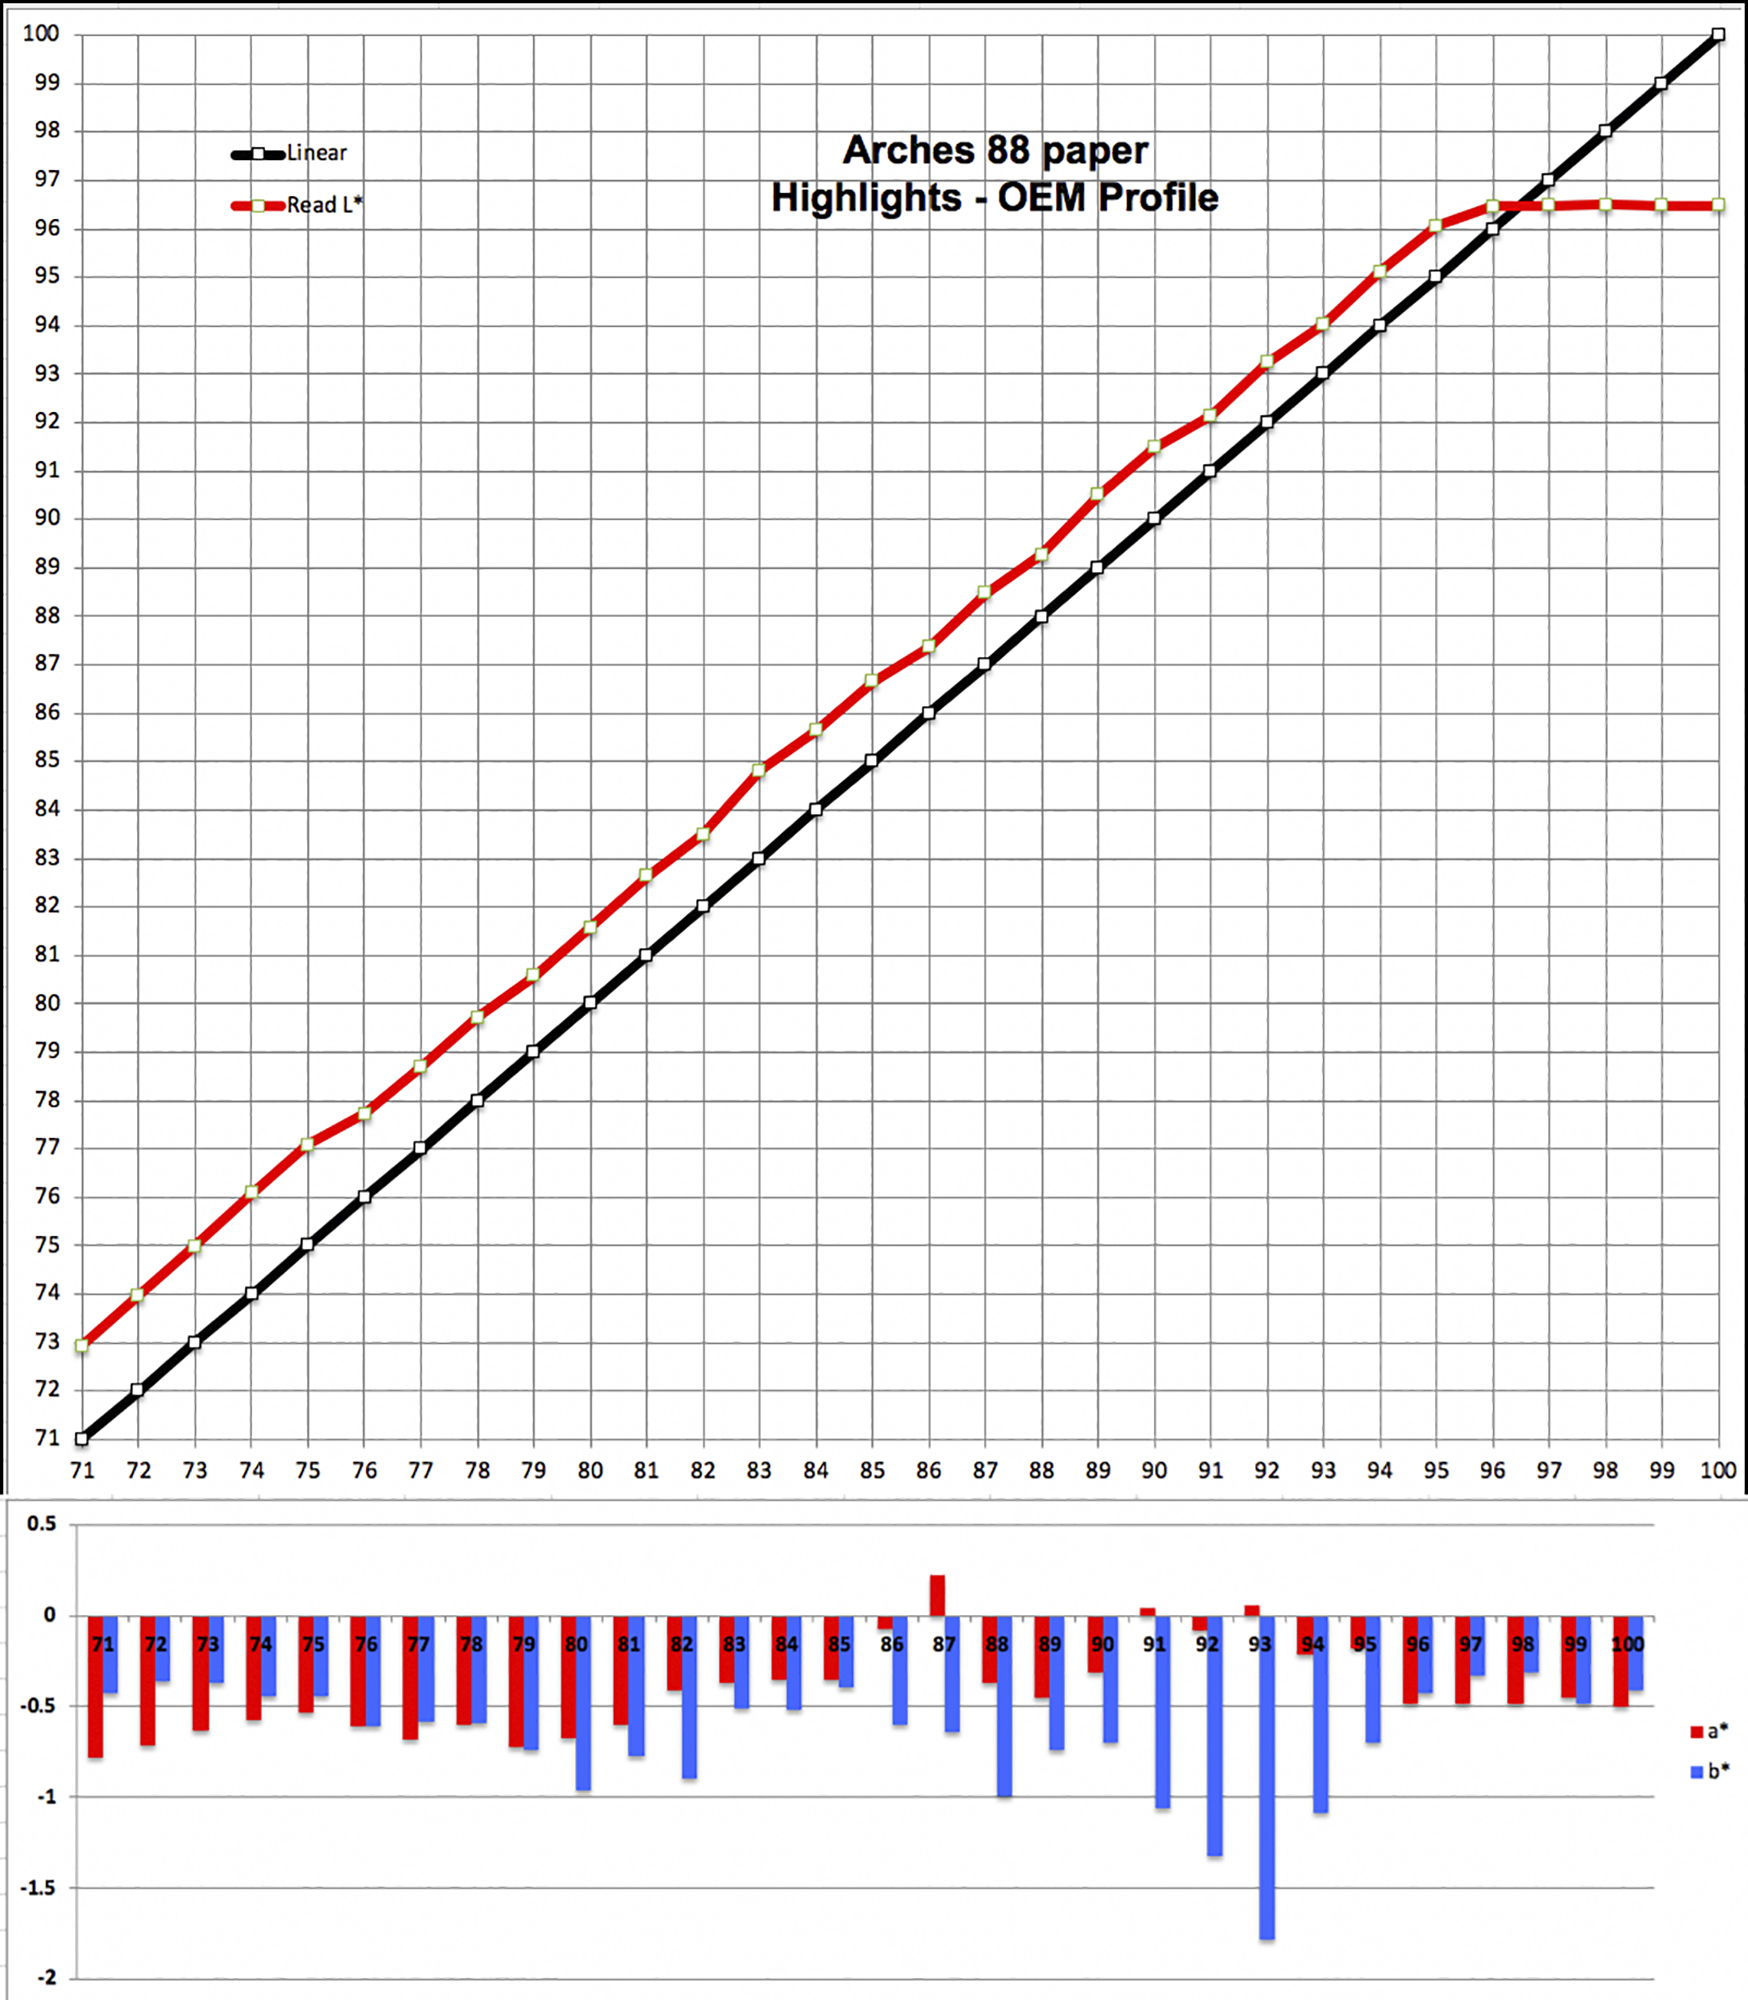
For the OEM profile (Figure 19), the relationship between the read values and the target reference values for the highlights continue the relationship established over the mid-tones, convergence happening at Level 97. Hue bias is reasonably well-contained in the highlight tones.
To remind, the characteristics displayed and explained above are broadly valid for all four papers. The indications are that these papers would be very suitable candidates for quality B&W printing, the character being slightly different in the darkest tones for the OEM profile compared with the Custom profile.
I turn now to the more tangible aspects of all these numerical findings – prints of real photographs and what they look like. The real photographs in this work are also printer evaluation targets, specially configured for testing printers and papers, but they consist of real photographs of recognizable subjects. I generally rely on four such targets for evaluating how the papers print:
- Atkinson printer test target
- Onsight target
- Roman 16 neutral dark tone B&W photo
- Roman 16 highlight colour photo
The first two are very good general evaluation targets that convey a lot of information about performance of colours and tonality, while the two Roman-16 targets are more specialized for examining performance of shadow and highlight detail rendition.
The figures below are scans of the target prints (printed using RELCOL + BPC), made with no editing, using a well-profiled Epson V850 scanner.
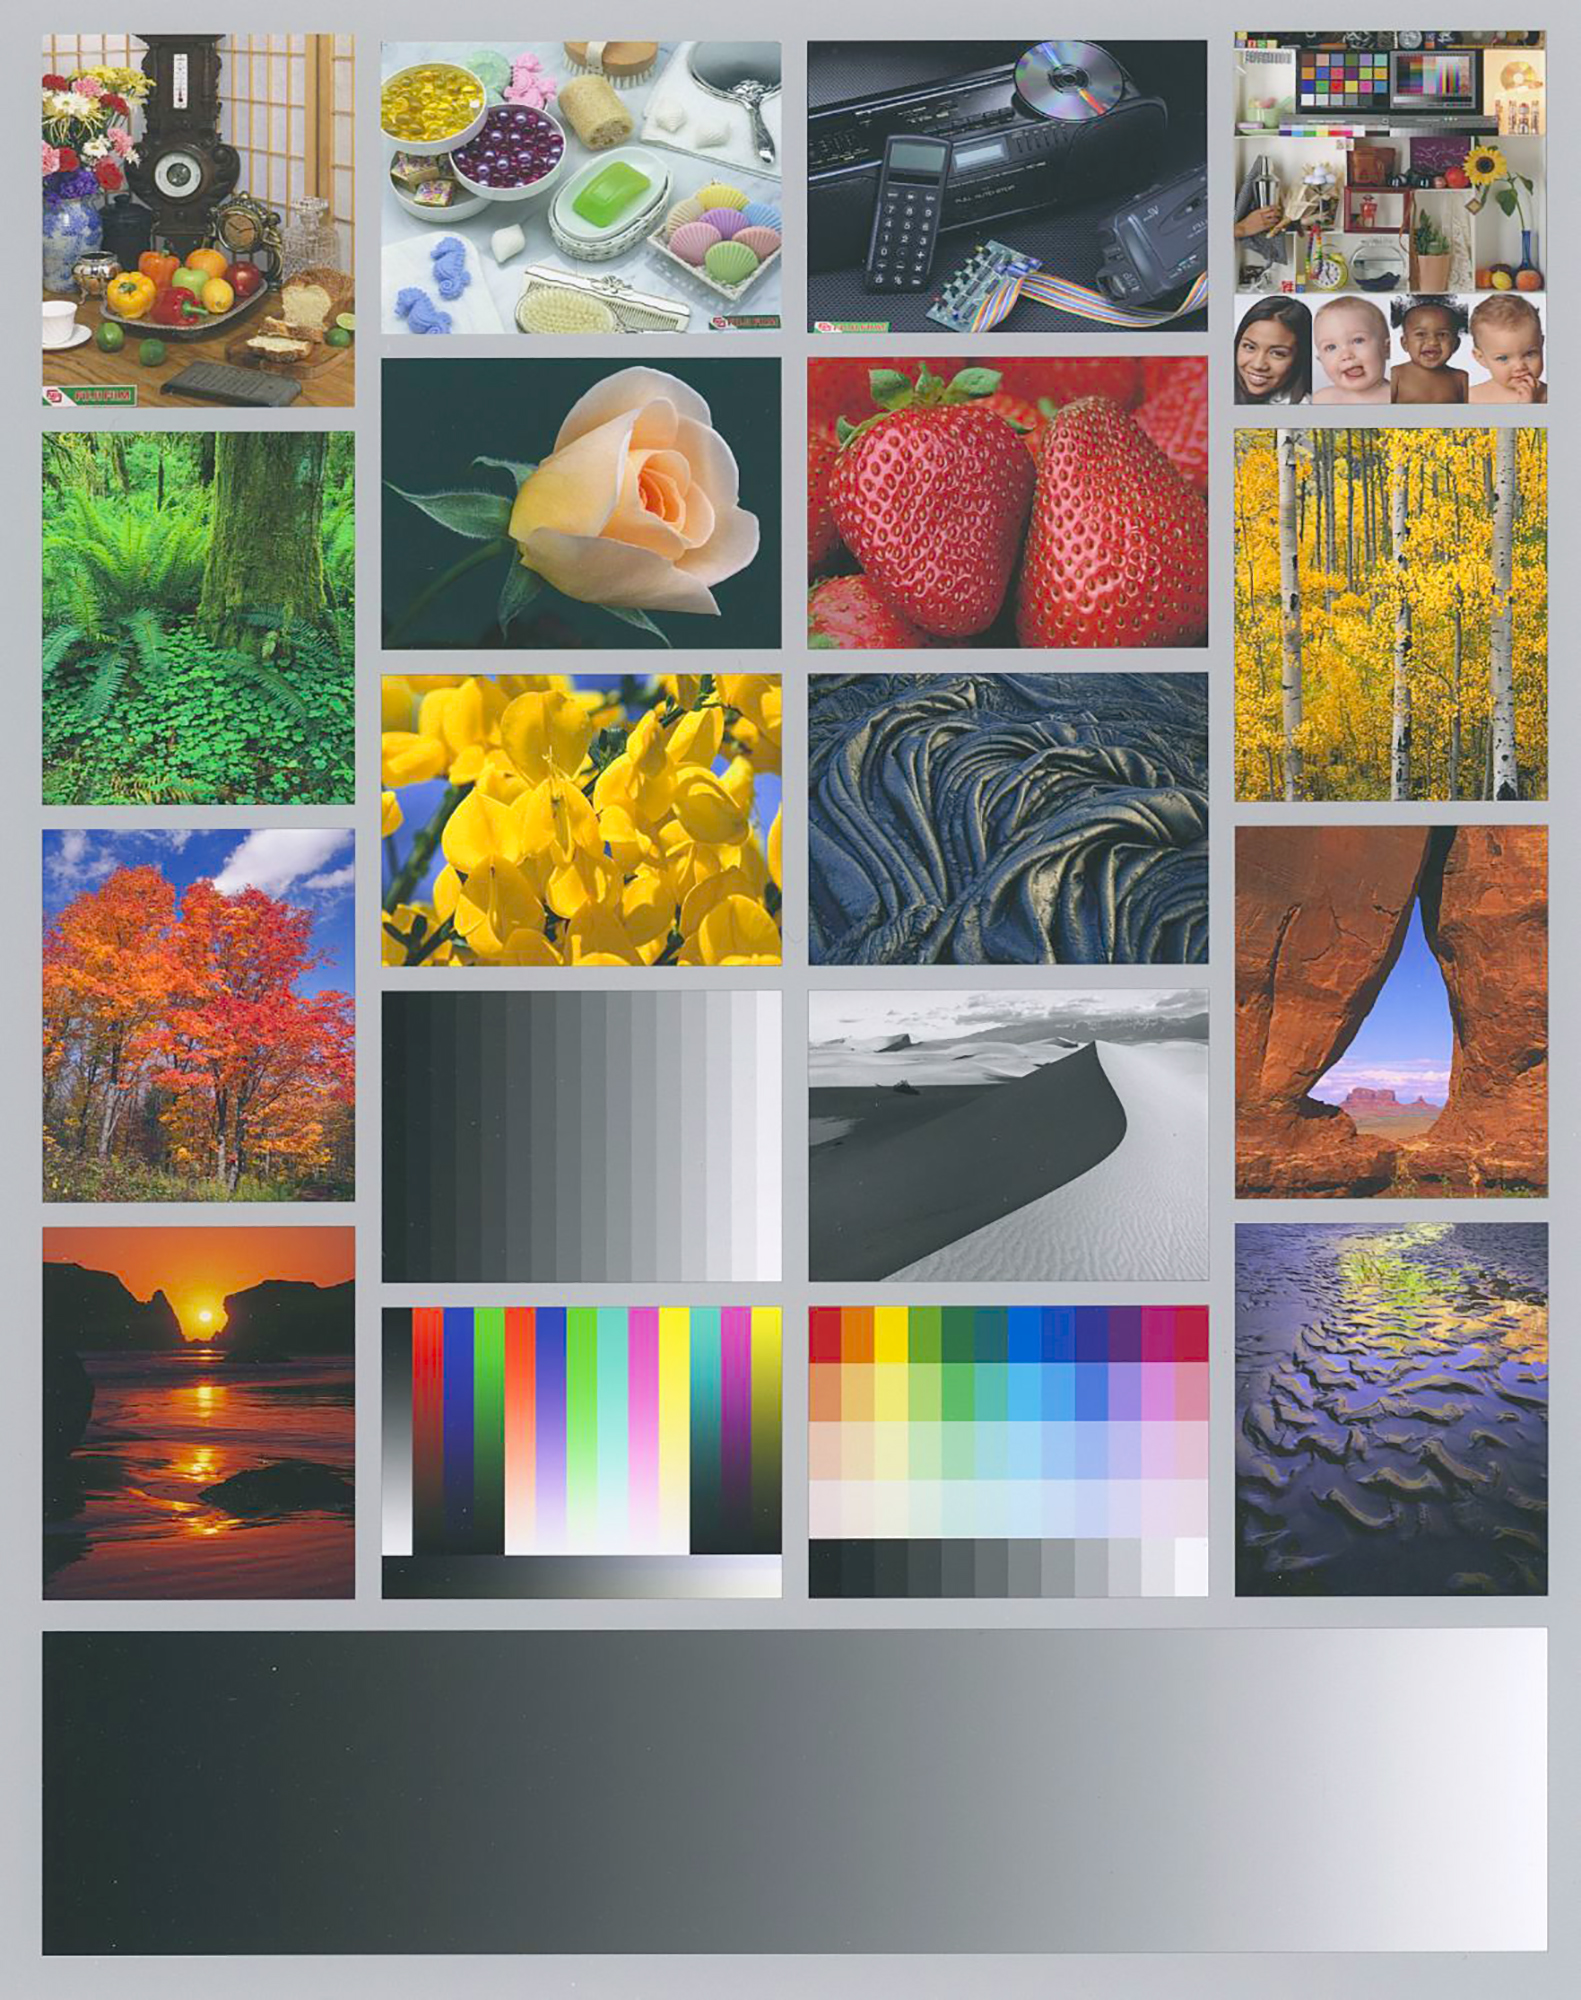
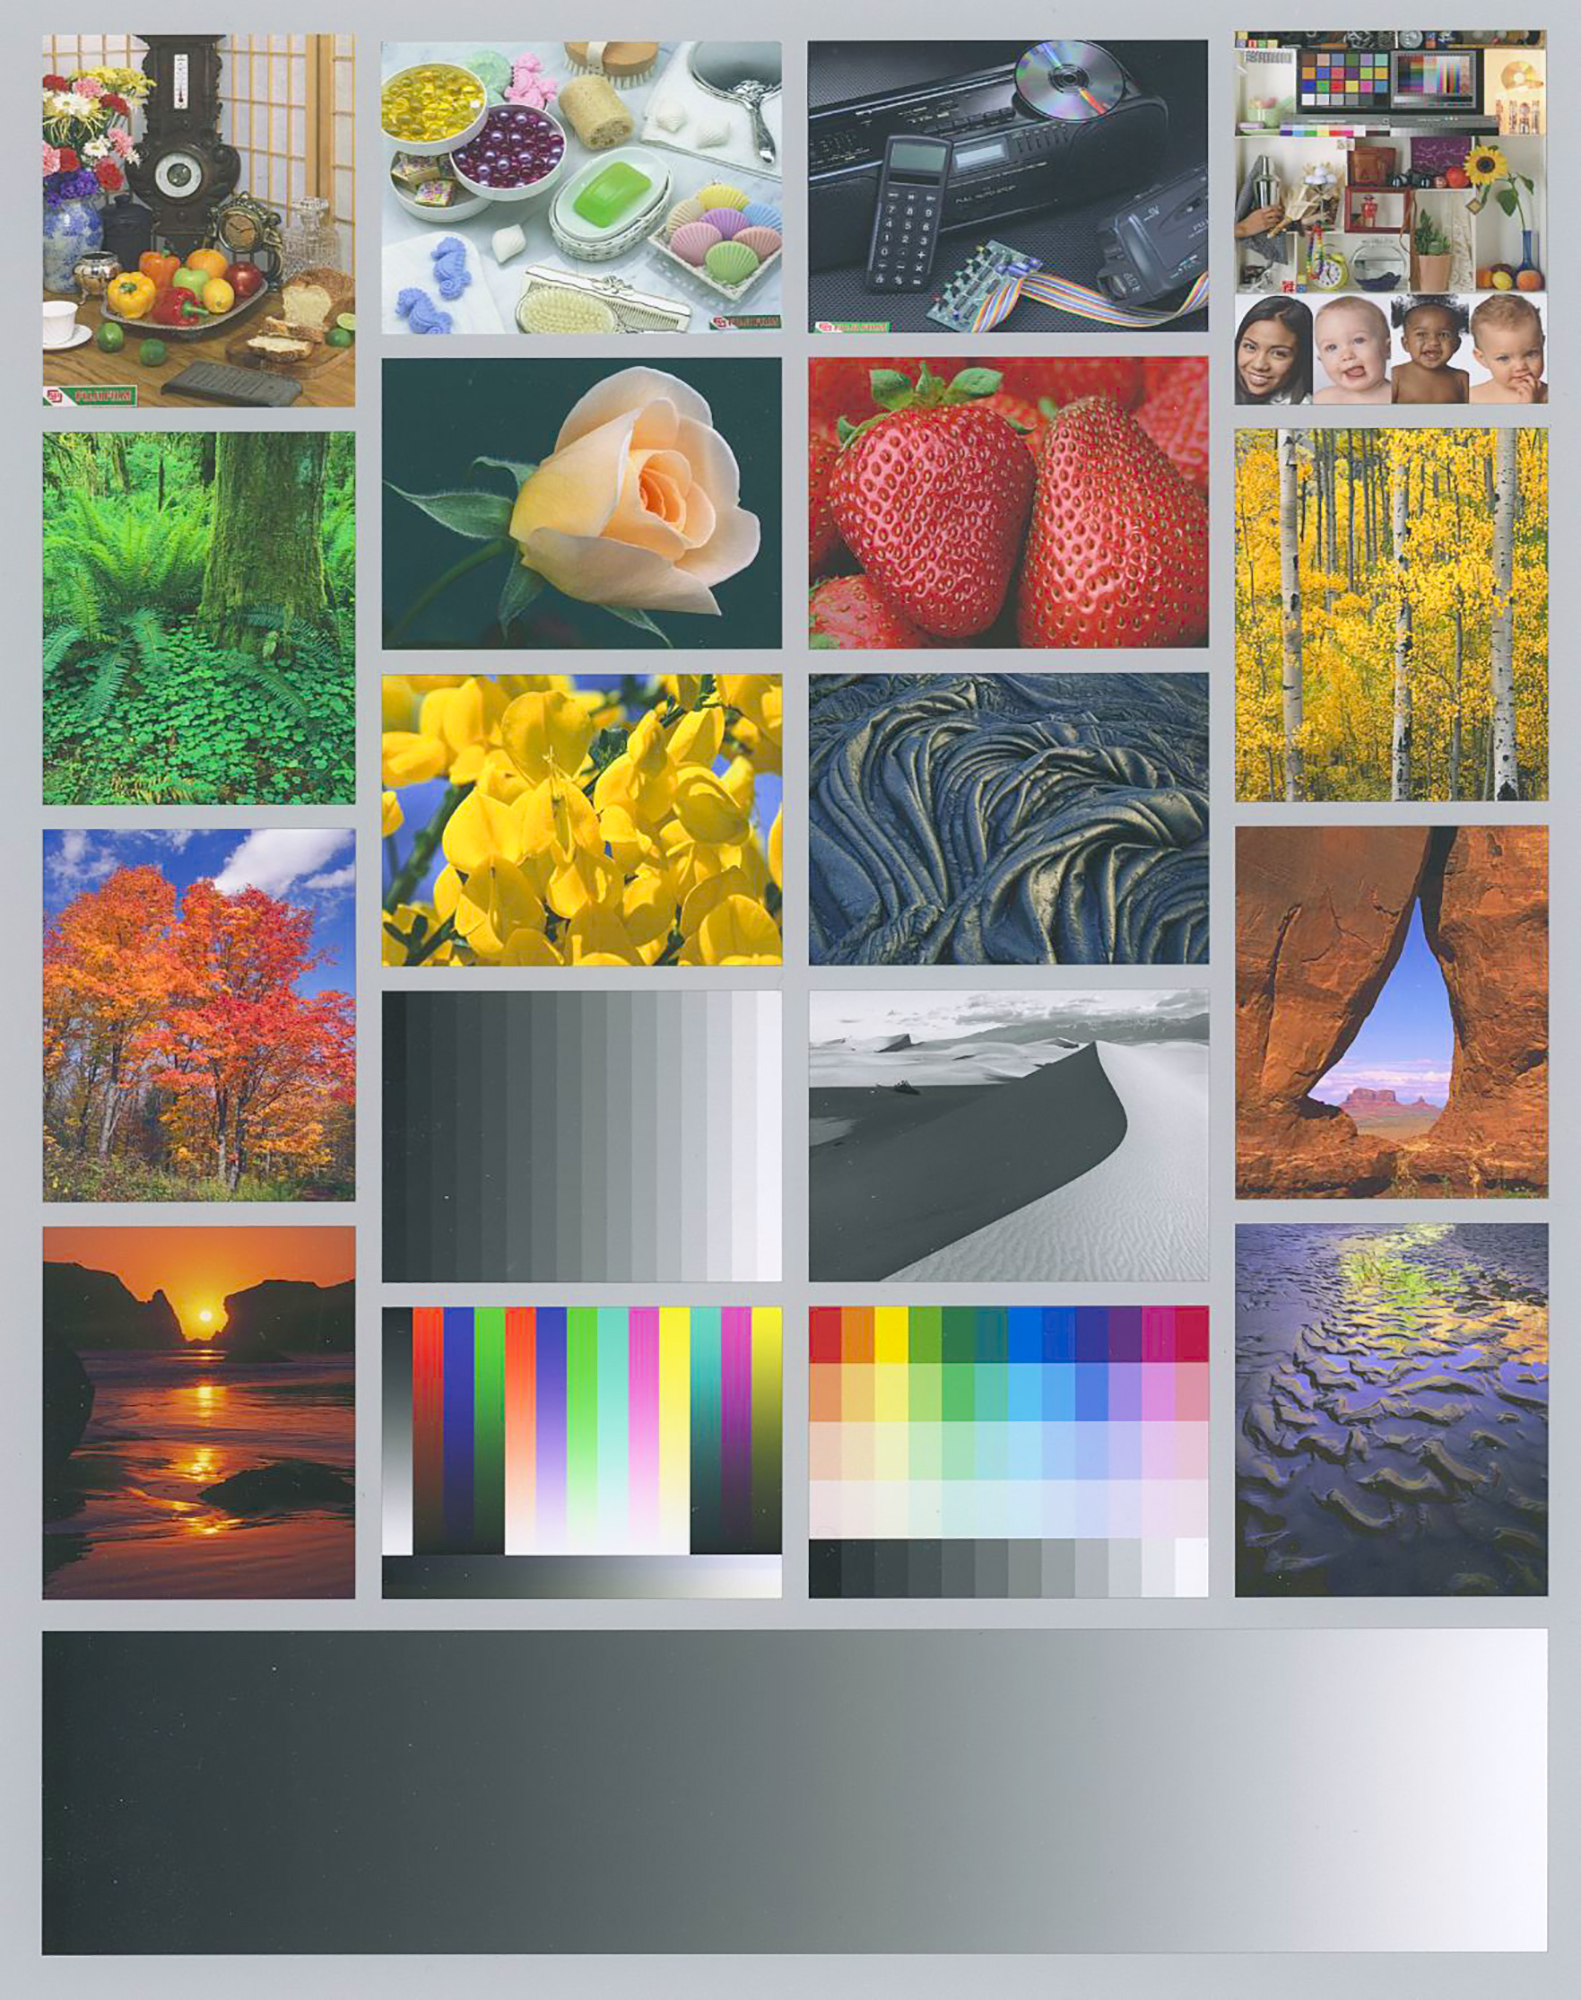
In both cases, careful examination of the prints indicates that the profiles perform well. The memory tones and colours of this target look right for high-quality matte papers. As expected from the diagrams above, the Custom profile has a slightly darker footprint than the OEM profile.
Particular attributes of the Onsight target that make it interesting to use for these tests is that it contains good image detail for assessing how the papers handle resolution of fine detail, and a range of blue and violet colours that pose challenges for some printer/paper combinations to render properly.
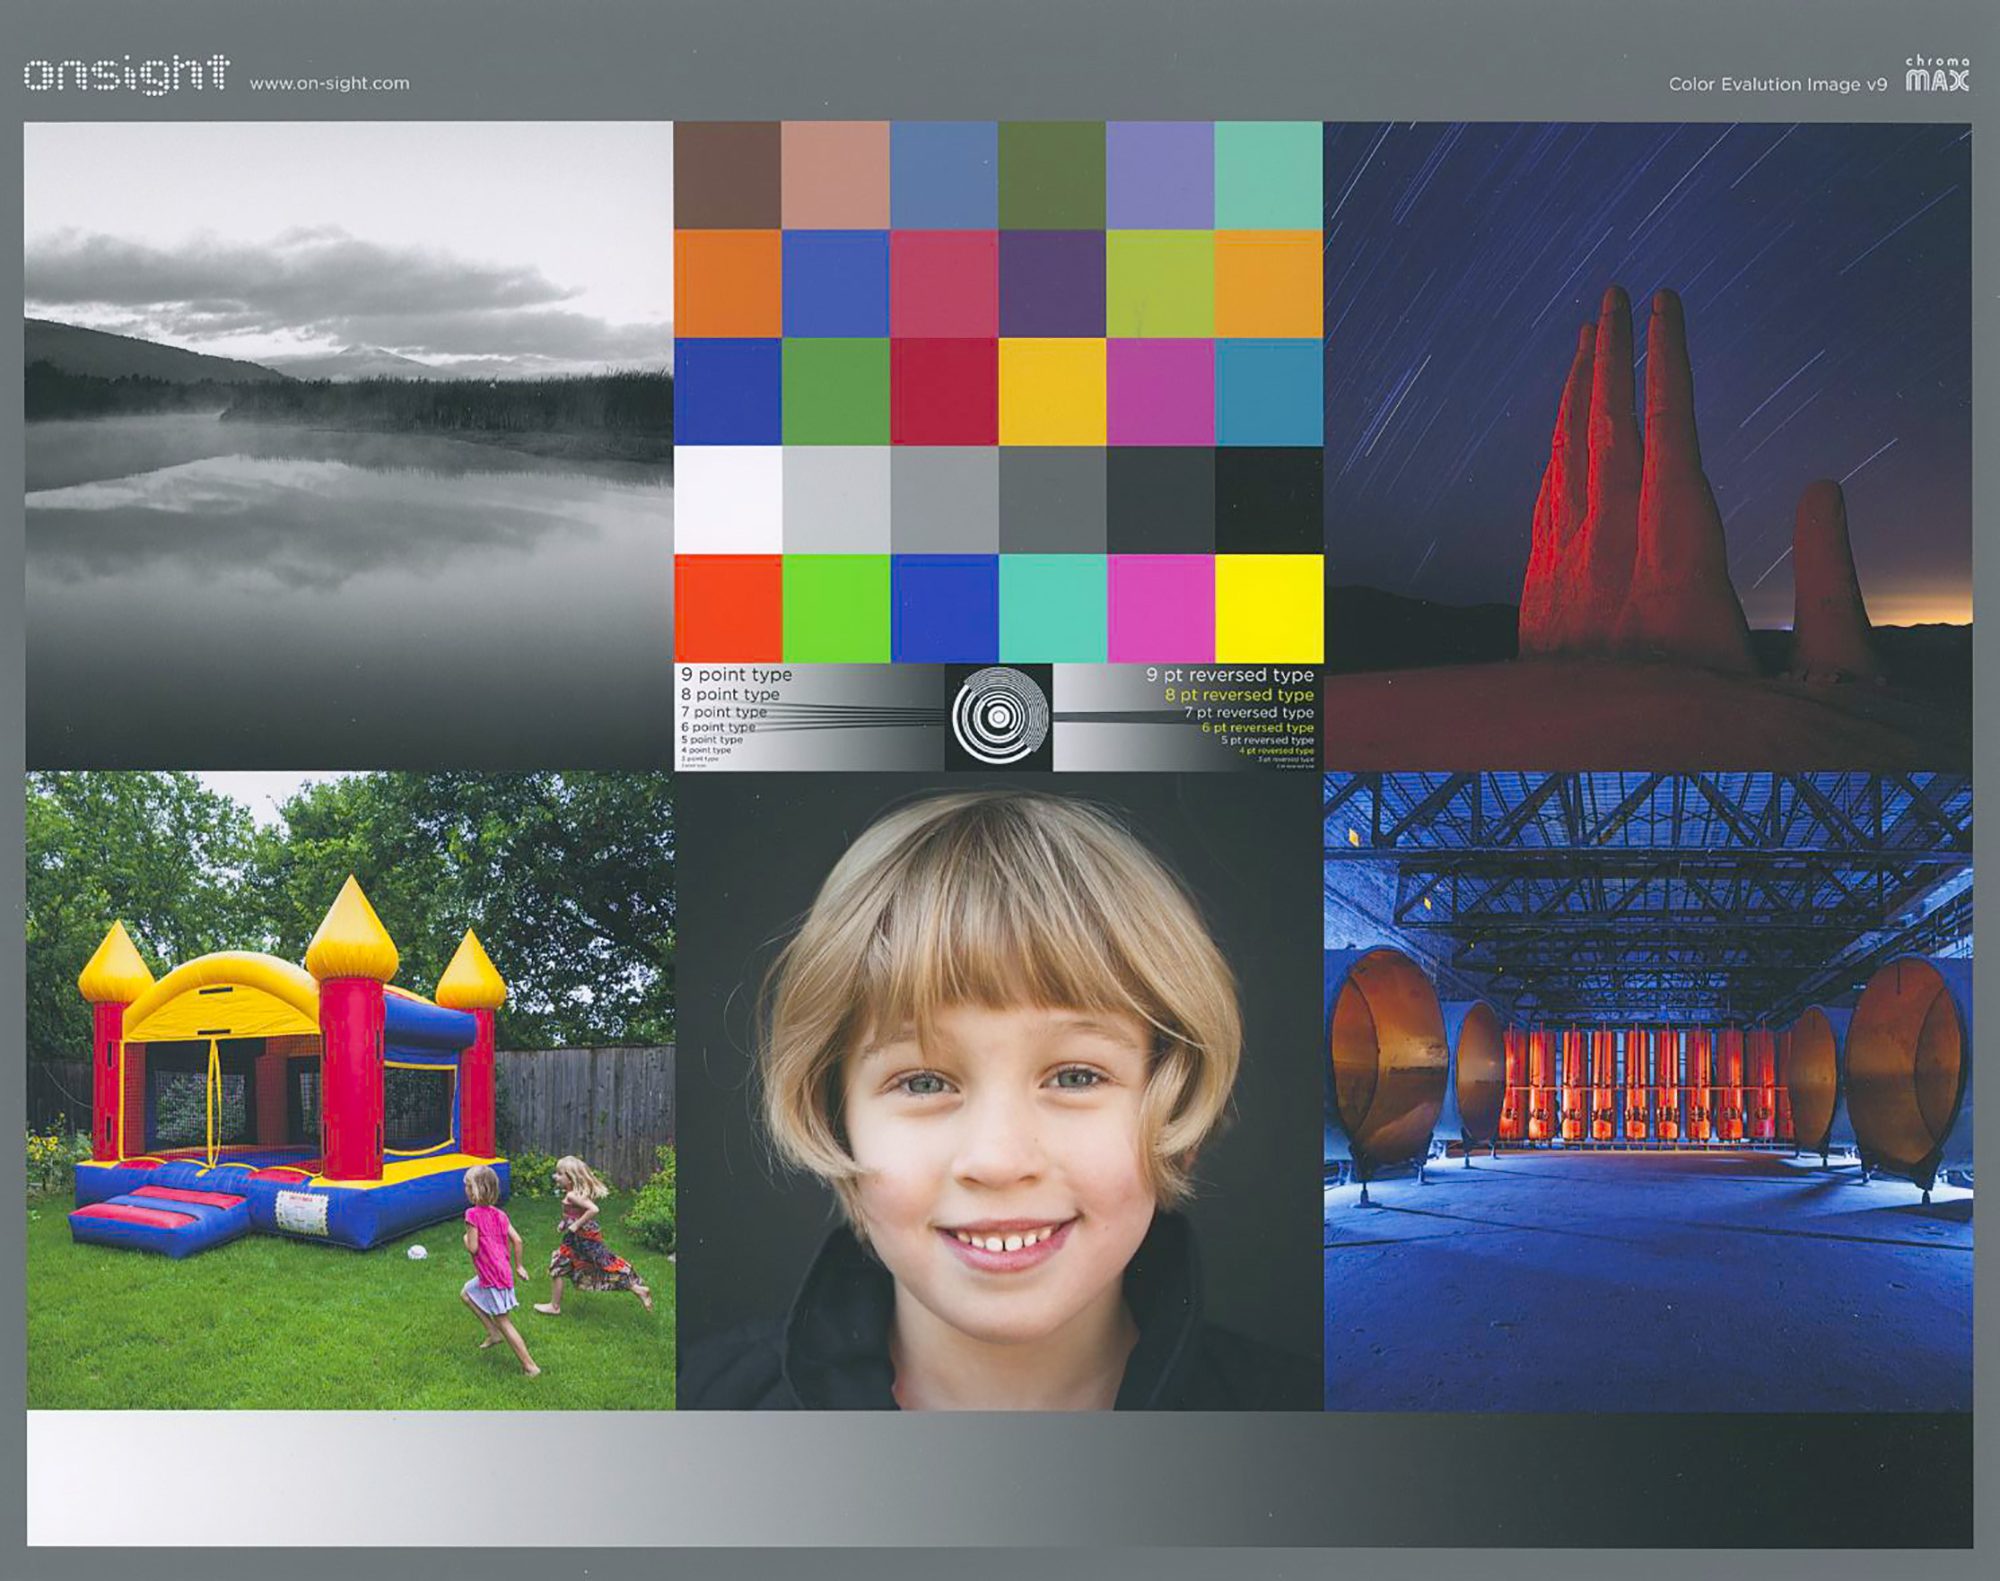
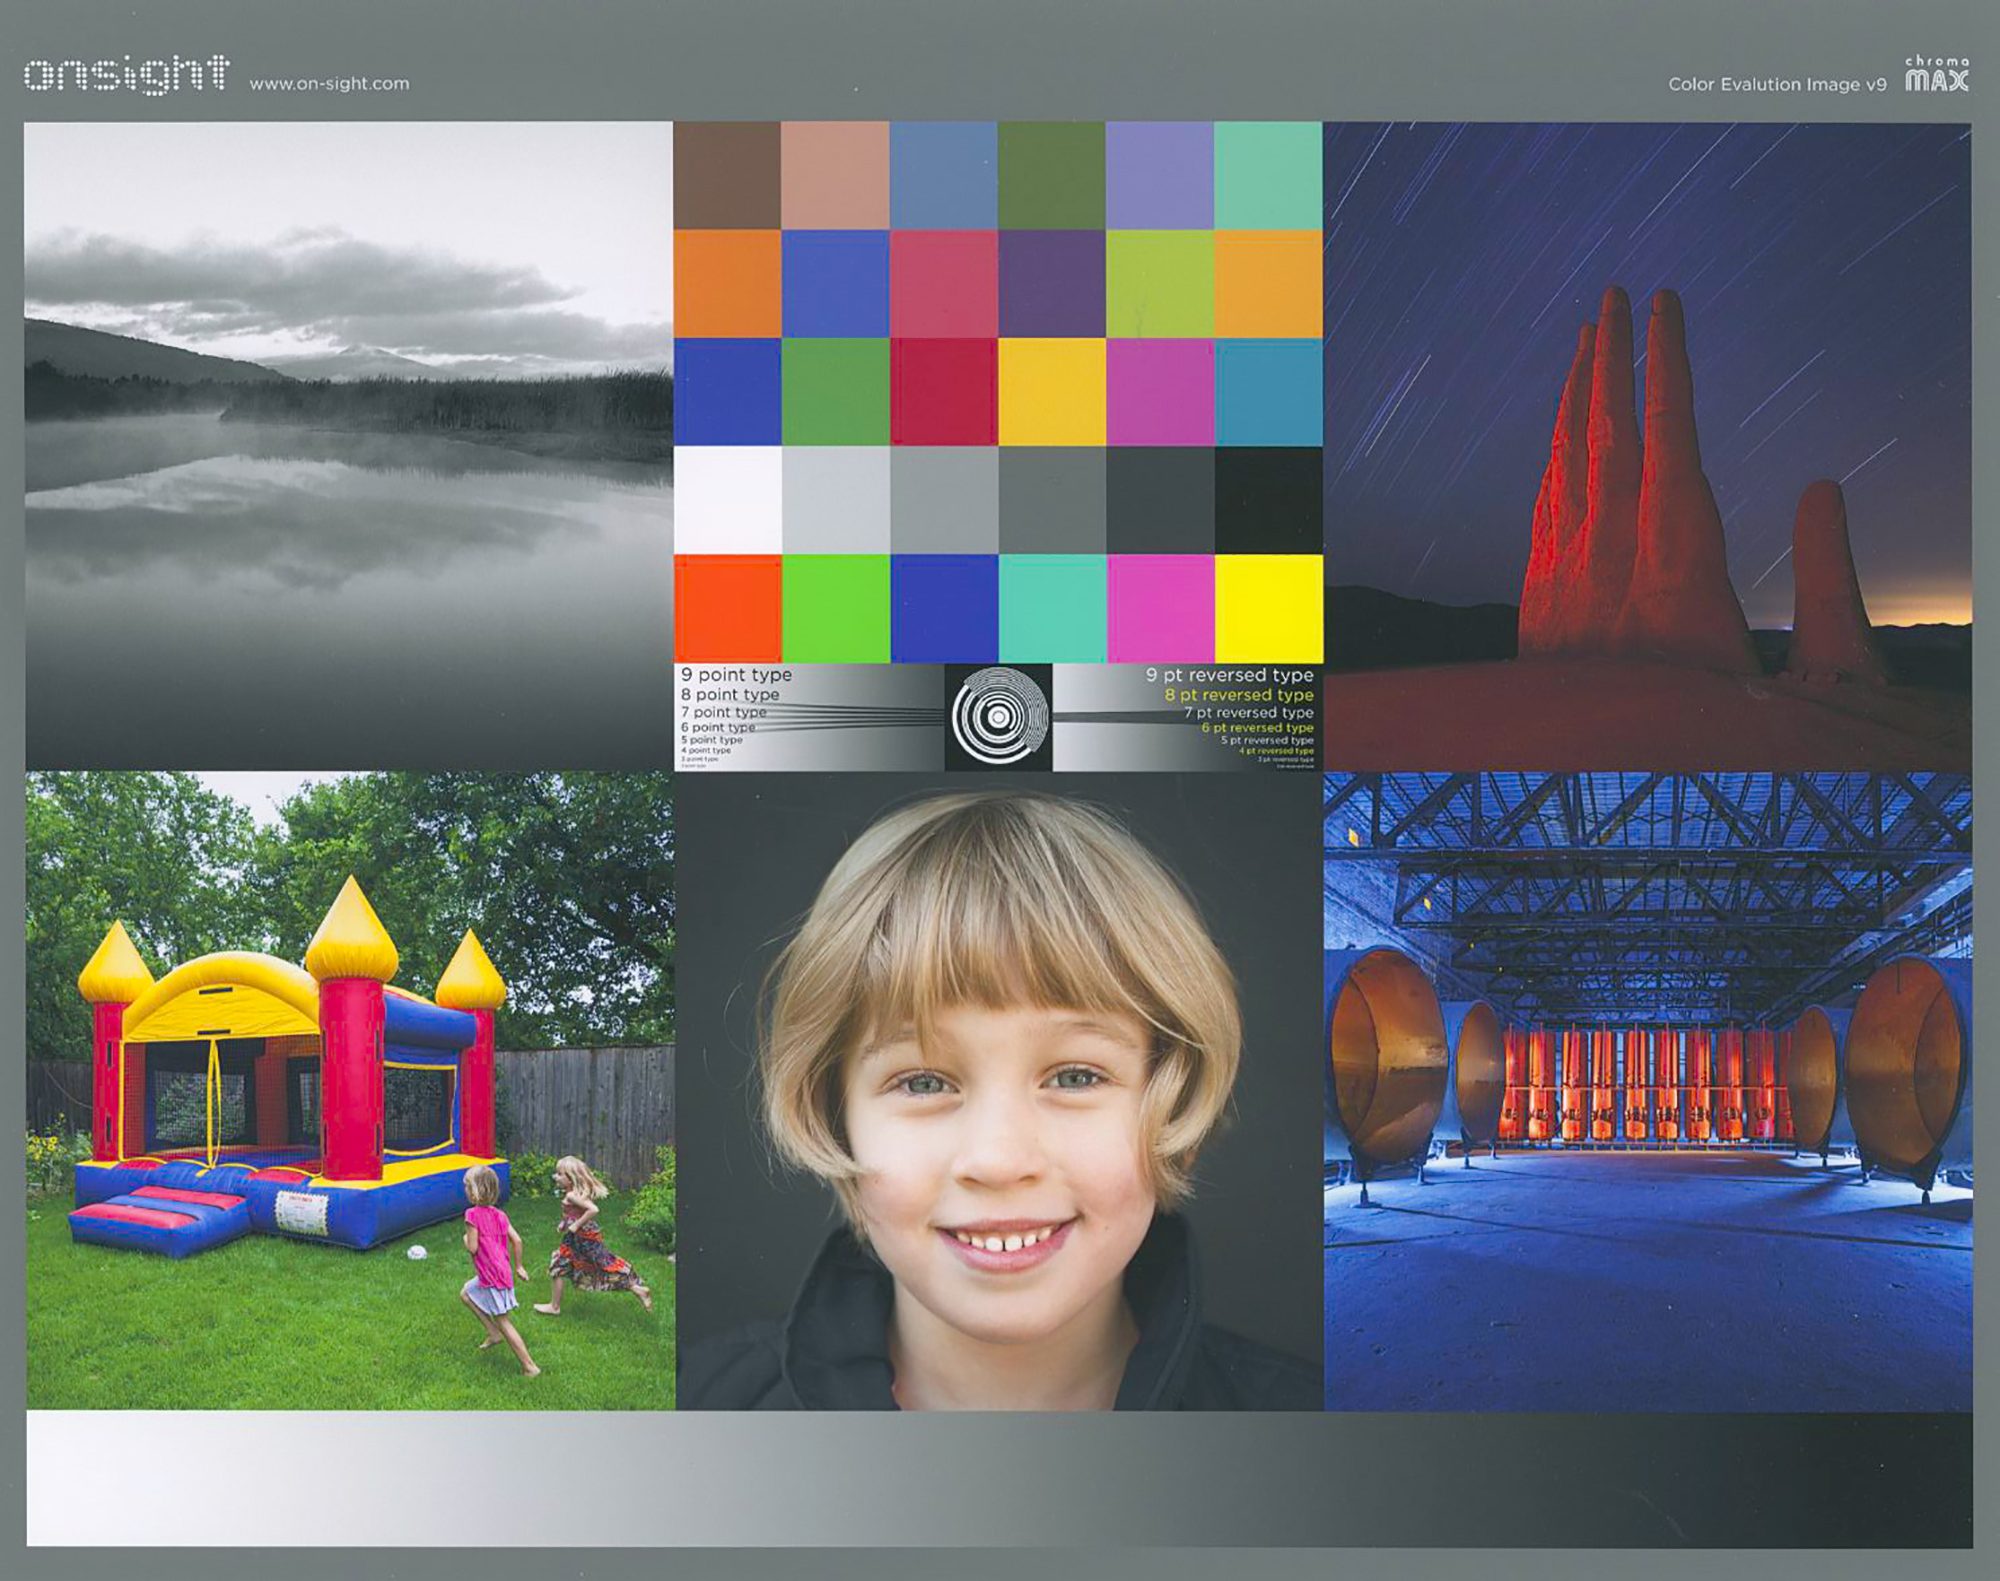
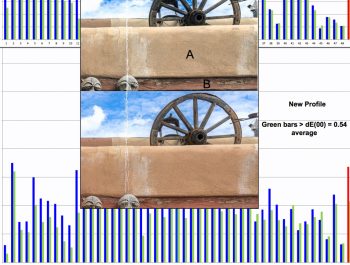
These two prints tell a very similar story as the previous two. The footprint of the OEM profile is slightly lighter than that of the Custom profile, the differences showing most noticeably in the right side, where in the upper right photo the deep red stands out slightly more in the OEM profile, and in the lower right photo the black girders are slightly more distinguishable from the background in the OEM profile. This is due to how the M3 profile handles the very dark tones as explained above. In both cases, detail rendition on these papers is excellent.
The comparison of the important parts of the dark evaluation photo in Figure 24 shows again the subtle differences between the M1 and M3 profiles.
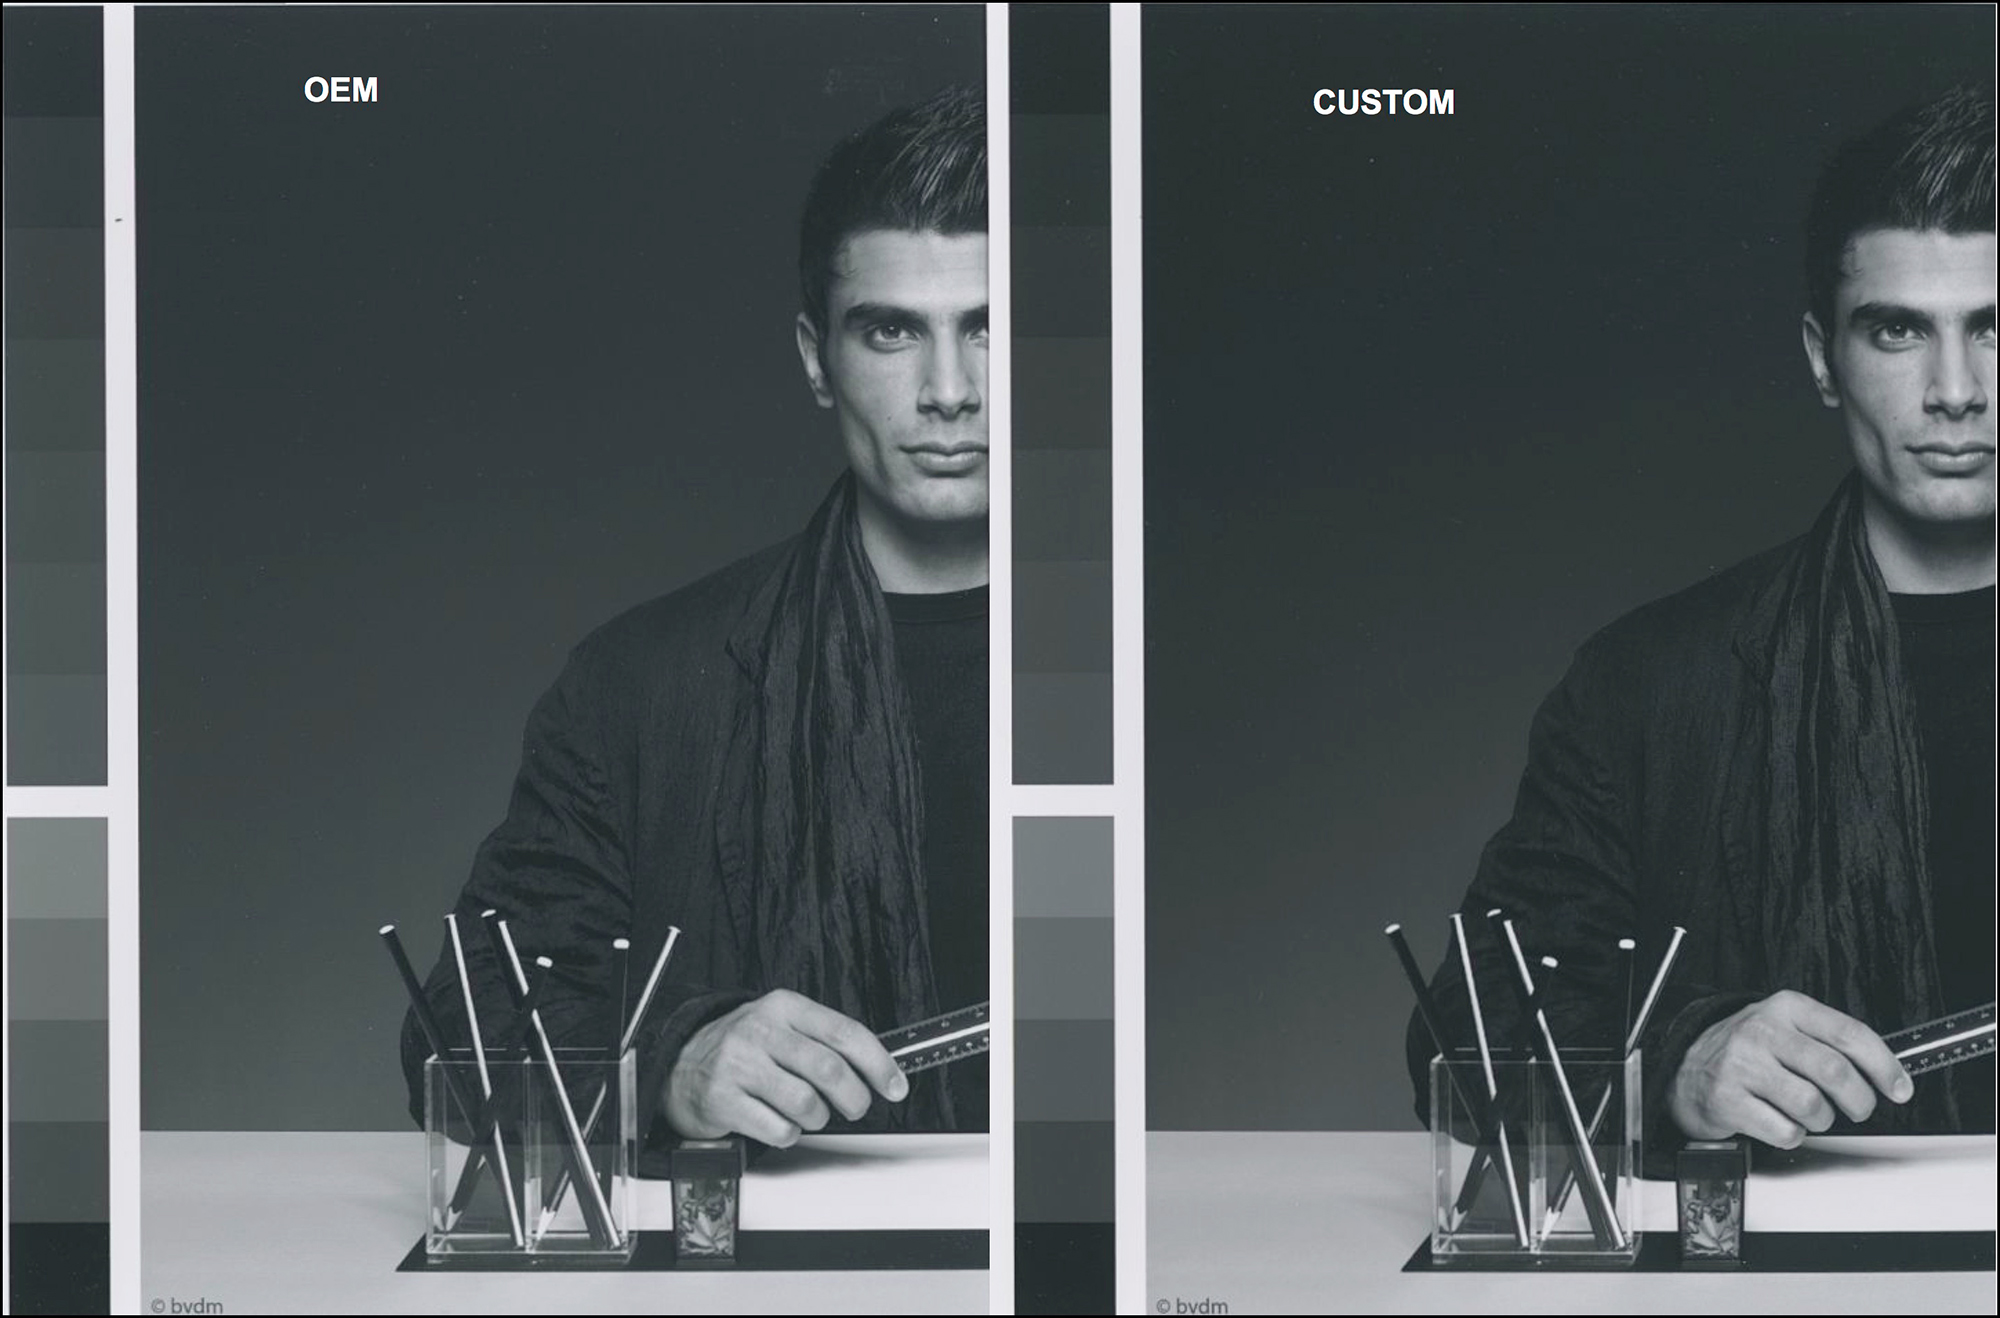
In both cases, gray neutrality is well rendered. However the character of deep shade tonality differs a bit. Whether you look at the separation of the black hair from the black background, or the fine tonal distinctions of the folds in the garment, the OEM M3 profile provides slightly more tonal separation than the M1 Custom profile. I should mention here that trying to exactly replicate this M3 effect using Photoshop or Lightroom Curves with the M1 profile is not as easy as you may think it should be! I don’t know why, but try it and your findings may be similar to mine. While on the subject of adjusting photos, I should mention, as an aside, M3 profiles cannot be reliably softproofed because the effect of the polarized lighting captured in the profile data does not represent what you end-up seeing in print under normal reflected light- specifically, the photos have superior depth and contrast in the softproof than they will show on paper when printed.
Finally, a similar kind of comparison is made for rendition of fine tonal distinctions in the highlight tones (Figure 25).
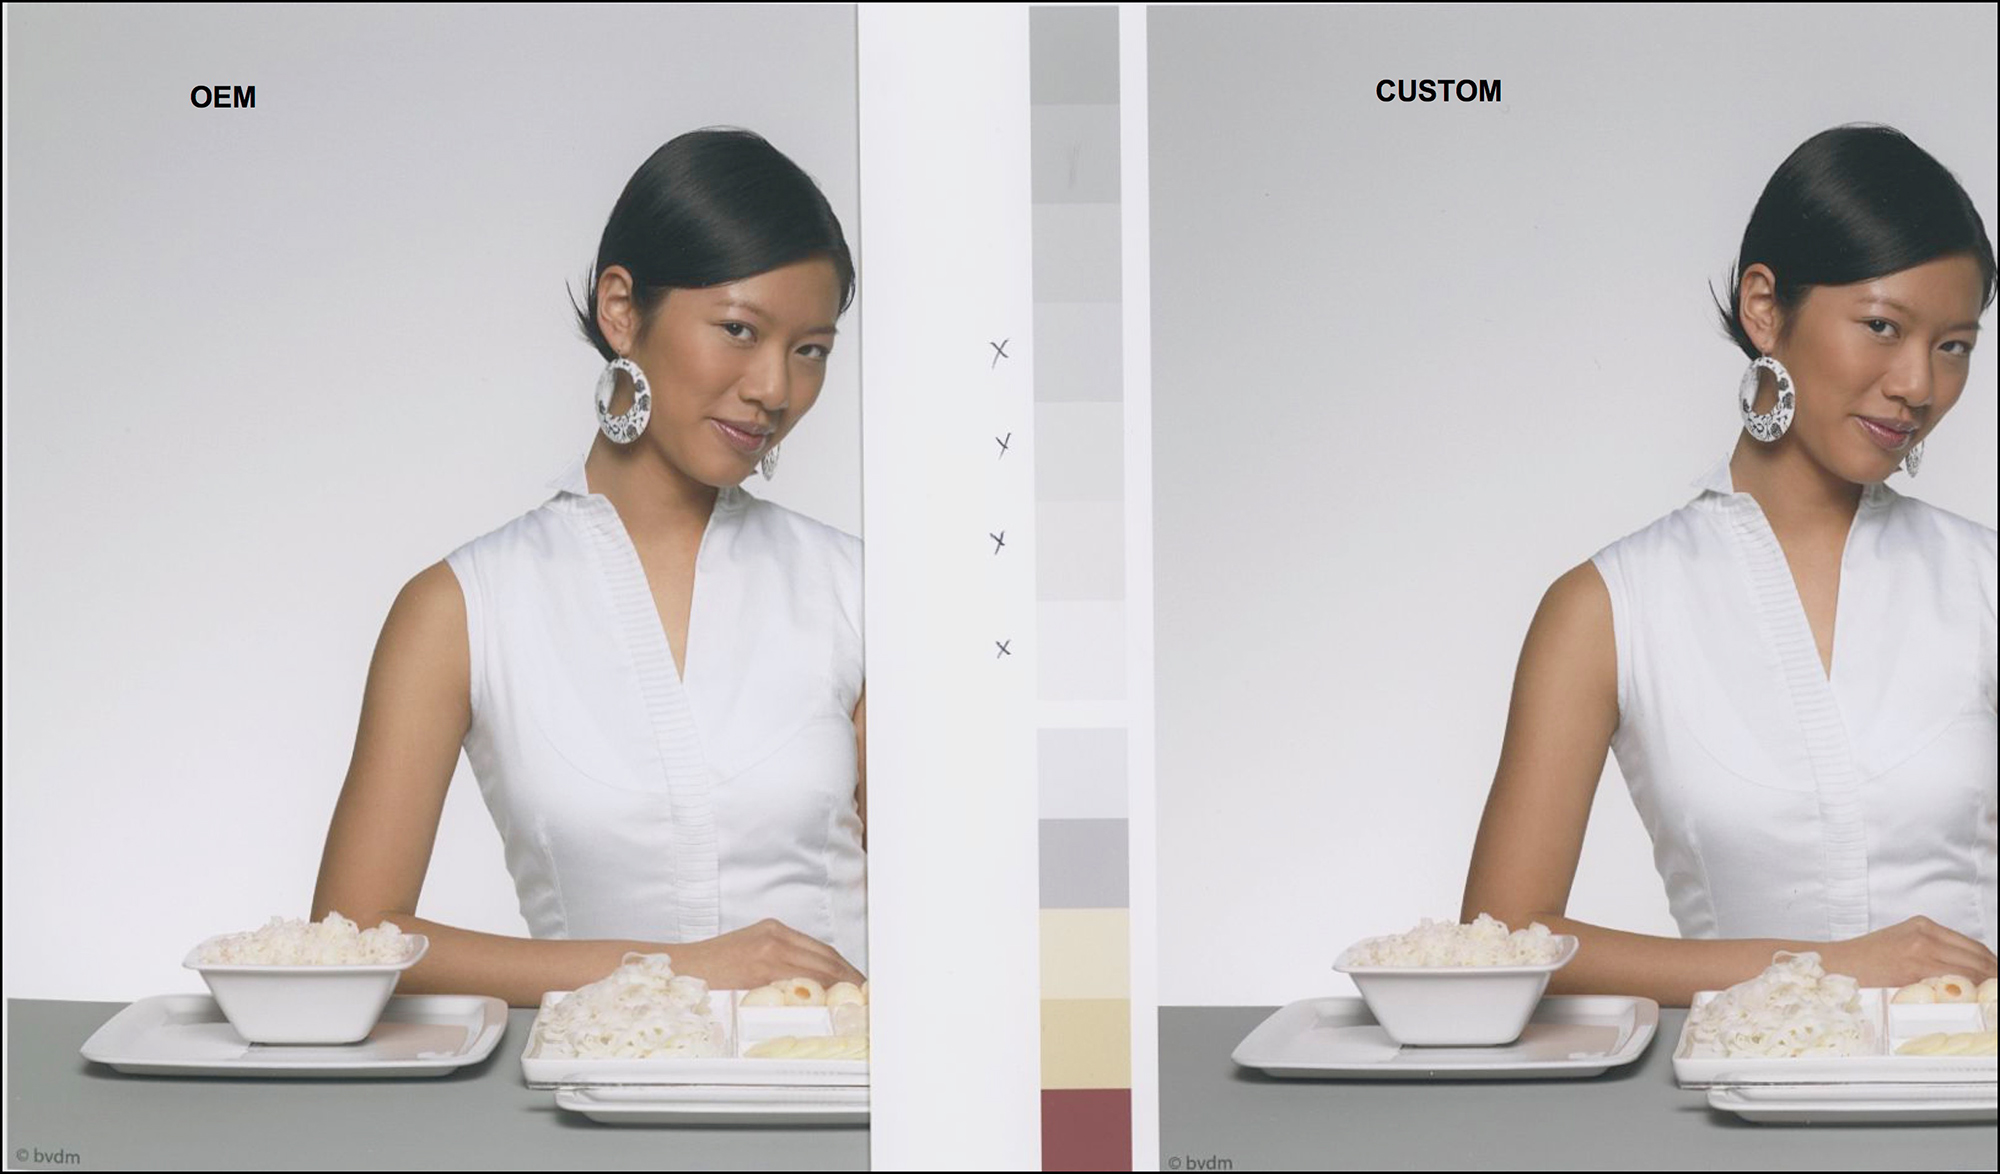
Here you need to look a bit carefully – and because this is only a photograph, you will not be considered rude or sexist peering into her garment, which is the key area of interest in this evaluation. The neckline of the outer garment has rather subtle detail, and there is slight tonal distinction beyond the neckline allowing you to see that there is an undergarment below the outer garment. To my vision, both profiles handle these distinctions well. As in the other examples, the OEM profile has a slightly lighter footprint than the Custom Profile.
Summary and Recommendation:
This review emerges from having made over 80 prints of test charts and test photos. It also benefits from the perspective I have developed over about two decades of working with a broad range of inkjet printers and media. I developed an objective approach to paper and printer testing– i.e. my observations are based on transparent methodologies producing relevant data that are repeatable and understandable to anyone well-enough informed on the basics of colour management and colour print work. There comes a point however, where the choice of papers is subjective. Prints are meant to be hand-held and how a photo looks and feels on paper depends on the photo, the paper and the person looking at them. After working with these papers for the time it took to prepare this review, I got to like them. They are robust, they have character, they are most likely archival (based on how they are said to be made) and they profile and print very well. If you are interested in expanding your options into new products, I recommend giving them a try.
Mark D Segal
July 2021
Toronto, ON
Mark has been making photographs for the past seven decades and started adopting a digital workflow in 1999 first with scanning film, then going fully digital in 2004. He has worked with a considerable range of software, equipment, materials and techniques over the years, accumulated substantial experience as an author, educator and communicator in several fields, was a frequent contributor to the Luminous-Landscape website and now contributes frequently with in-depth articles on the PhotoPXL website. Mark has contributed over 75 articles to the two websites up to Q1-2024, with a particular emphasis on printers and papers, given his view that a photograph printed on paper remains the epitome of fine photography, as it has been from soon after the medium was invented and started gaining momentum in the 1830s/1840s. Mark developed a particular interest in film scanning and authored the ebook “Scanning Workflows with SilverFast 8, SilverFast HDR, Adobe Photoshop Lightroom and Adobe Photoshop” (please check our Store for availability). In his “other life” (the one that pays for the photography), Mark is a retiree from the World Bank Group and was a consultant in electric power development.